
In what seems like a record trading session on July 24, the U.S. stock market lost $1.1 trillion in value as the sell-off in large-cap stocks continued, with the members of “Magnificient Seven” alone losing more than $750 billion.
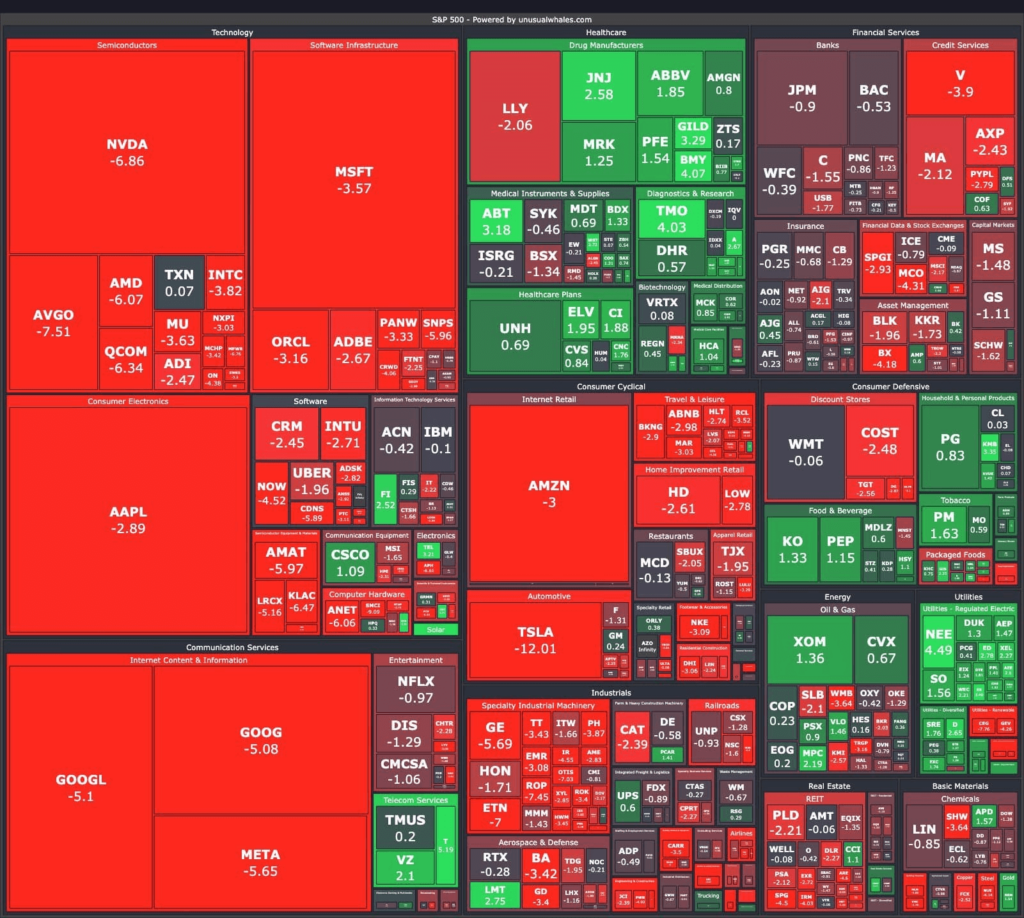
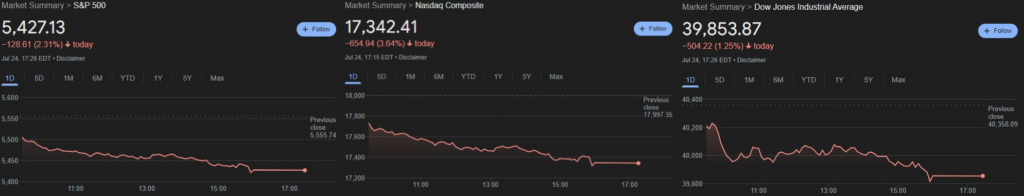
This is the worst stock market loss since 2022, with the broad market index (S&P 500) falling by 2.31% to 5,427.13, marking its first larger-than-2 % decline since February 2023.
The tech-focused Nasdaq dropped 3.64% to close at 17,342.41. The Dow Jones Industrial Average decreased by 504.22 points, or 1.25%, to 39,853.87.
This loss could be a sign of things to come for the stock market
Released earnings reports for most of the stock market topped analysts’ expectations; however, some segments like Alphabet’s (NASDAQ: GOOGL) YouTube advertising revenue coming in below the consensus estimate, and Tesla (NASDAQ: TSLA) posting a miss on EPS contributed to the drawdown in the stock market.
These reports offer investors their first glimpse into how megacap companies performed in the second quarter. Wall Street pays particular attention to these reports because this small group of companies has driven most of this year’s gains.
Wednesday’s sell-off resulted from an overbought market, high expectations for earnings, and a seasonally weak period for equities. According to Ross Mayfield, an investment strategist at Baird, this pullback was not entirely unexpected.
“We view this sell-off as ultimately quite viable because it’s happening within the context of a bull market,” Mayfield said in an interview with CNBC. “A healthy correction inside a bull market presents opportunities rather than a need to become defensive or protect your money from volatility.”
Weak manufacturing data bolstered stock losses
According to an S&P Global flash reading of purchase managers, manufacturing unexpectedly contracted in July as new orders, production, and inventories declined.
The U.S. PMI flash manufacturing output index dropped to 49.5, down from 52.1 in June, hitting a six-month low. Economists surveyed by Dow Jones had anticipated a reading of 51.5.
Despite this, the services index remained strong, rising to 56.0—a 28-month high—from 55.3 in June, exceeding the forecast of 55.0.
These indexes measure the percentage difference between companies reporting expansion and contraction. A reading above 50 indicates expansion, while below signals contraction.
There might be a silver lining in this report, as it may prompt the Federal Reserve to cut interest rates sooner than expected.