
The Bitcoin Rainbow Chart, a valuation model that tracks Bitcoin’s (BTC) price along a logarithmic growth curve, points to a broad but defined range by February 28, 2026.
Its projection places Bitcoin anywhere from the low $40,000 area to just under $460,000, depending on the valuation band.
The lowest band, ‘Basically a Fire Sale,’ between roughly $41,800 and $54,700, signals extreme undervaluation driven by panic and capitulation, while the ‘BUY!’ band from about $54,700 to $73,700 reflects levels that have historically supported long-term accumulation as downside risk diminishes.
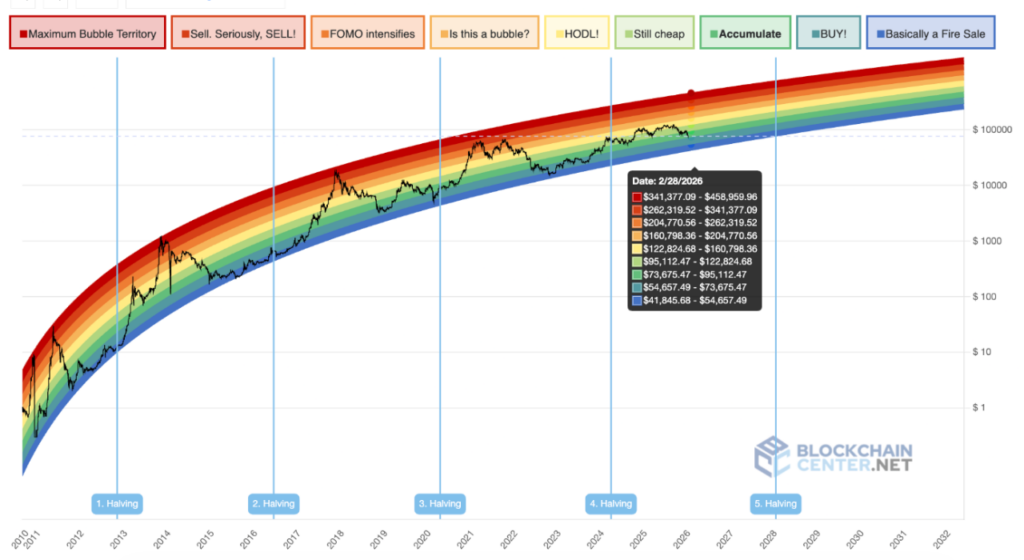
Next is the ‘Accumulate’ band, ranging from approximately $73,700 to $95,100, signaling a market that is still cheap on a long-term basis but no longer distressed, often seen in early recovery phases. The ‘Still cheap’ band follows, projected between about $95,100 and $122,800, indicating continued undervaluation relative to Bitcoin’s long-term trend despite improving sentiment.
The ‘HODL!’ band, from roughly $122,800 to $160,800, represents fair value, where long-term holders are typically incentivized to hold rather than aggressively trade. Above that, the ‘Is this a bubble?’ band, between about $160,800 and $204,800, points to rising speculation and increasing overheating risk.
Bitcoin’s bubble territory
Higher bands reflect growing euphoria. In this line, ‘FOMO intensifies’ spans approximately $204,800 to $262,300, a phase marked by fear-driven inflows and higher volatility. ‘Sell. Seriously, SELL!’ follows between roughly $262,300 and $341,400, historically linked to late-cycle excess and elevated downside risk. At the top, ‘Maximum Bubble Territory’, projected from about $341,400 to $459,000, has coincided with unsustainable rallies and major market peaks.
With the cryptocurrency trading near $75,900 on February 4, it sits close to the lower edge of the ‘Accumulate’ band relative to the February 28, 2026 projection. If price tracks its long-term trend rather than speculative extremes, the Rainbow Chart implies a fair-value outcome by late February 2026 in the upper ‘Still cheap’ zone and lower ‘HODL!’ band, around $120,000 to $160,000.
From today’s level near $76,000, the model suggests Bitcoin could deliver substantial upside without entering bubble territory. Even prices below $95,000 in early 2026 would remain within ranges historically associated with long-term value rather than excess.
Bitcoin price analysis
By press time, Bitcoin was trading at $76,027, having dropped by over 2% in the past 24 hours. On a weekly basis, the asset is down nearly 15%.
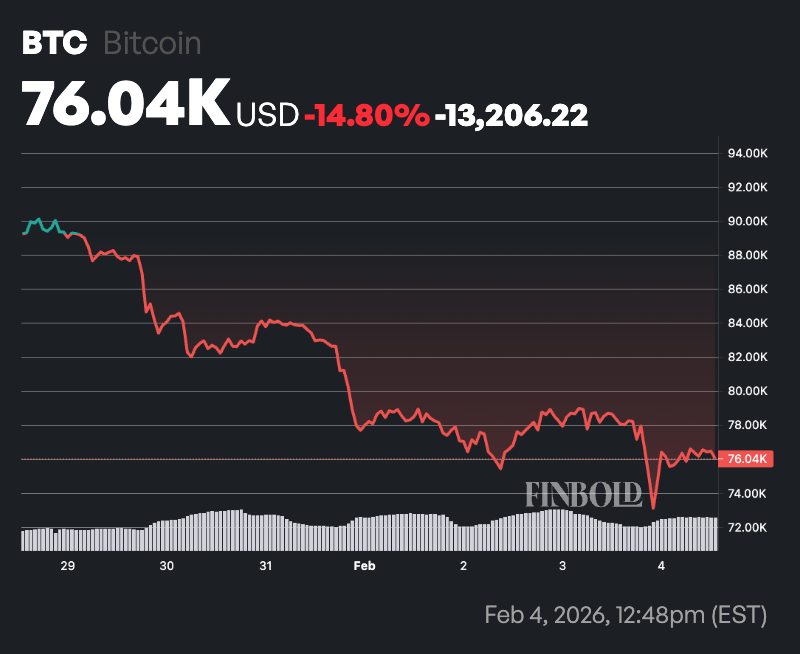
At the current price, Bitcoin remains in a clearly stressed market. Price is firmly below its 50-day SMA near $89,000 and the 200-day SMA around $103,500, pointing to a strong bearish trend.
However, the 14-day RSI at roughly 26 signals deeply oversold conditions, suggesting selling pressure may be nearing exhaustion and setting the stage for a potential short-term rebound, even as the broader trend remains negative.
Featured image via Shutterstock