Uber Technologies (NYSE: UBER) is trading close to its highest point this year but it’s still far from the 2021 peak. Can it get there in the next 12 months?
Wall Street analysts believe so.
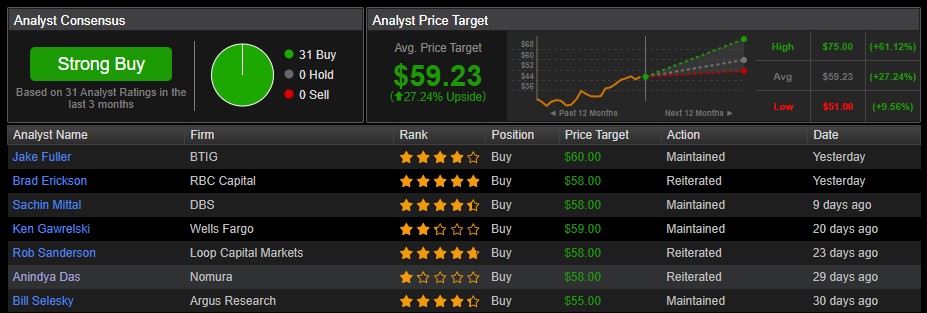
Analyst target price sees a 27% gain
Uber has a ‘Strong Buy’ rating from 31 analysts in the past three months and not a single analyst has a hold or sell rating. Their average target price for the next 12 months is $59, which is 27% above the current market price of $46.
Most analysts see the price trading under $60, with the highest price target being $60 from Jake Fuller, a BTIG analyst.
It’s no wonder that analysts are becoming increasingly bullish about the stock. Uber recently reported its first quarterly operating profit in Q2, making a net income of $394 million for the quarter, up $1 billion year-over-year (YoY). Its gross bookings grew 16% YoY and trips grew 22% YoY.
Dara Khosrowshahi, CEO of Uber said, “robust demand, new growth initiatives, and continued cost discipline resulted in an excellent quarter, with trips up 22% and a GAAP operating profit, for the first time in Uber’s history.”
Uber said that it expects gross bookings of between $34 billion and $35 billion in Q3.
Daniel Ives, an analyst for Wedbush said after the Q2 release, “with another strong quarter of healthy growth and cost discipline, we believe path to $5 billion+ adj. EBITDA in 2024E and significant positive free cash flow is becoming increasingly clear.”
If Uber continues this path, it could easily break the $60 top and maybe even go beyond within the next 12 months.
Uber stock technical analysis
Uber has been making higher highs and higher lows throughout the year where it started at $25 per share in January and traded close to $50 in July this year.
The top was marked with a bearish engulfing pattern on the weekly chart, though. This is a reversal pattern that appears in an uptrend.
After the pattern appeared, the stock started to lose momentum in its effort to break the $50 resistance level. Unless this happens in the coming days, we could easily see the price retreat to $40.

The support price of $40 coincides with the 100-day moving average on the daily chart, as well as with the trendline from the beginning of the year. This makes it a strong level and a good accumulation point if you’re bullish long-term.
Despite the recent pullback, UBER has returned 83% year-to-date, outperforming the S&P 500’s 17% return within the same period.
Buy stocks now with Interactive Brokers – the most advanced investment platform
Disclaimer: The content on this site should not be considered investment advice. Investing is speculative. When investing, your capital is at risk.