
The United States stock market is flashing warning signals, with equity valuations now surpassing levels seen during past major economic downturns.
Notably, markets hit a new all-time high on August 25, pushing valuations into the same extreme percentile ranges historically observed before major crashes, according to data by Bloomberg shared by Barchart on September 1.
These downturns include the Great Depression of 1929, the market crash of 1965, and the Dot-com bubble of 1999.
The data reflect a mix of valuation metrics, including trailing and forward price-to-earnings ratios, cyclically adjusted P/E, price-to-book, price-to-sales, enterprise value-to-EBITDA, Tobin’s Q ratio, and market capitalization relative to GDP.
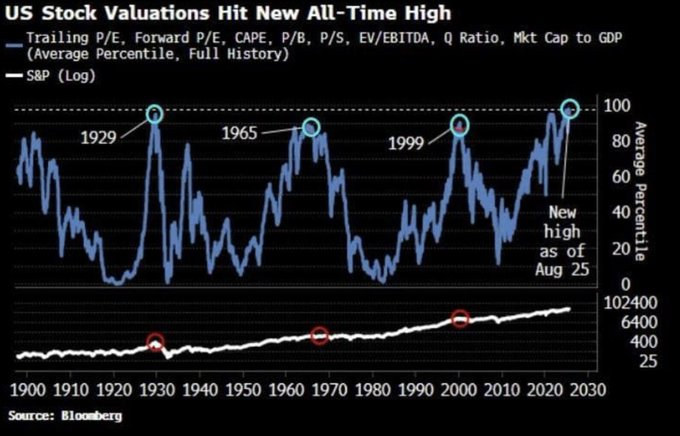
Together, these indicators now place equities in the highest percentile in recorded history, levels last seen in 1929, before the Great Depression; 1965, ahead of a prolonged bear market; and 1999, before the Dot-com collapse.
Despite these warnings, the S&P 500 has continued to climb, with its long-term logarithmic trendline showing steady growth over the past century.
Market crash concerns
Still, the sharp rise in valuations compared to historical averages is fueling concern among analysts and investors that the market may be entering overheated territory.
It is worth noting that, while markets have been surging in recent months, concerns about a potential crash persist. Earlier this year, panic triggered by tariffs led to a notable downturn, followed by an eventual recovery, with most of Wall Street downgrading recession calls.
Notably, as reported by Finbold on August 24, speculative trading in zero-day-to-expiry (0DTE) options surged to record levels. In Q3 2025, 0DTE contracts averaged 65% of S&P 500 options volume, peaking at 69% on August 23. This surge could amplify volatility and trigger sudden sell-offs.
Featured image via Shutterstock