Warren Buffett, ‘the Oracle of Omaha,’ is rightfully considered one of the world’s premier investors. Unlike many others, Buffett’s philosophy is simple to distill — it’s focused on buying stock in businesses that have solid fundamentals at fair prices, or in other words, stocks you can hold forever.
Ideally, those businesses possess a competitive advantage or an economic moat, and shares are purchased when the company is trading below fair value estimates. The approach is referred to as value investing and relies on valuations as a critical component of analysis.
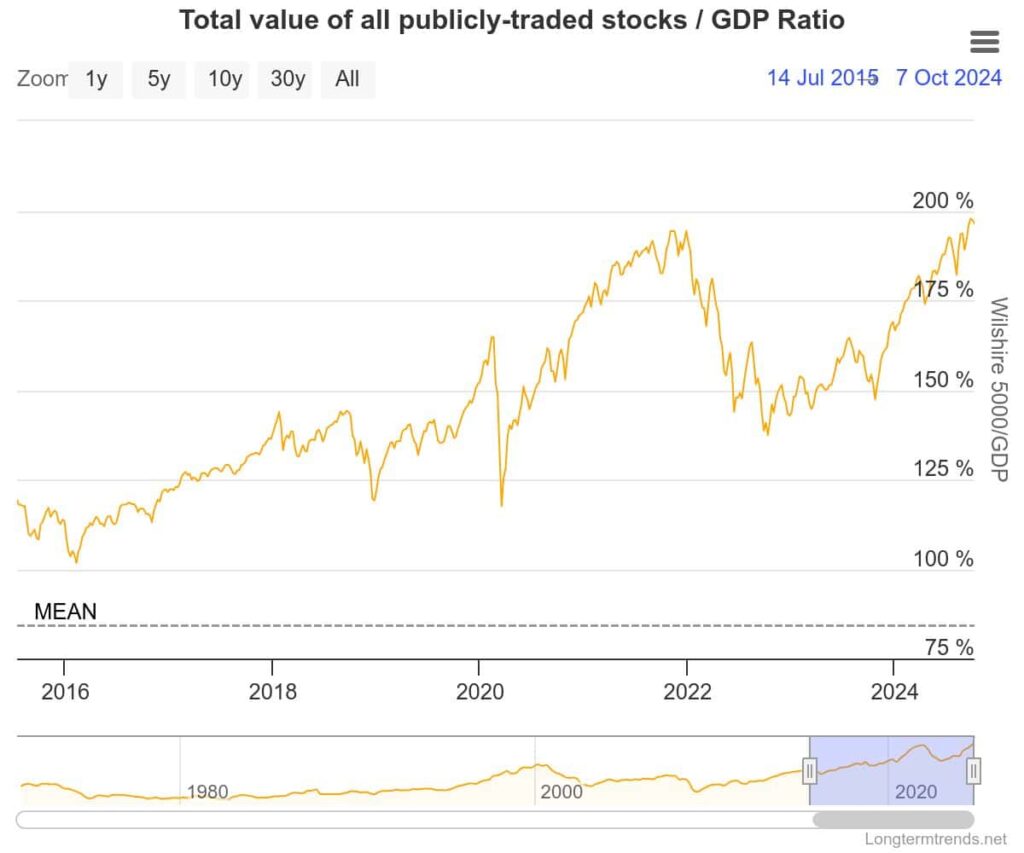
Buffett himself came up with a simple formula to determine if the market, as a whole, is overpriced — the Buffett indicator.
To determine the metric, one simply needs to compare the total market cap of publicly traded U.S. companies to the country’s GDP. The indicator currently stands at an all-time high — 197%.
Factors driving the Buffett Indicator to new highs
Although the markets have been witness to a high interest rate environment, which traditionally brings valuations down, the sequential order of events is important to consider. Prior to this, a decade-long environment of persistently low interest rates was in place, buoying valuations.
As that factor changed and interest rates rose, large portions of the market piled into equities in search of superior returns. In the same period, we’ve seen the rise of tech giants like Nvidia (NASDAQ: NVDA), Amazon (NASDAQ: AMZN), and Meta (NASDAQ: META) — all of which have reached incredibly high valuations in an apparent race to a $4 trillion market cap.
On top of the rise of tech as a sector, we’re in the midst of a transformative period with AI — a development that holds the potential to unlock even higher profits and valuations.
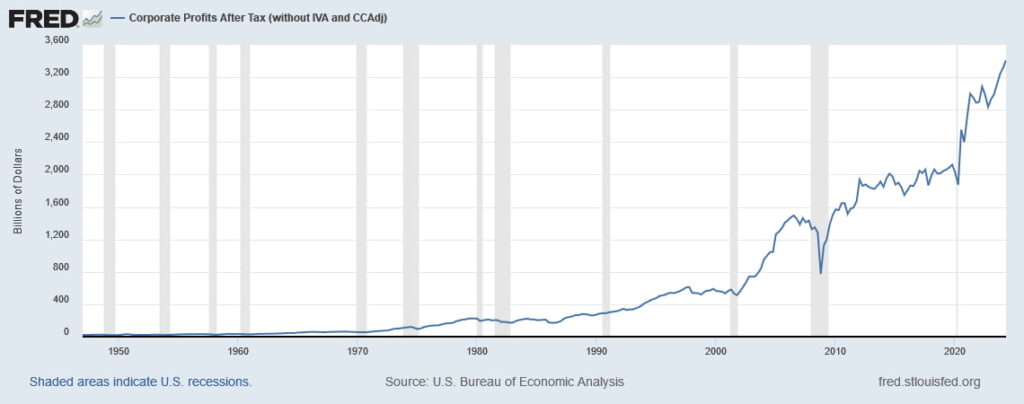
As noted by Buffett himself, robust corporate profitability can support higher valuation levels even when the fundamental case for them is not present — and corporate profits are at hitherto unseen levels.
The Buffett Indicator and recessions
During previous economic downturns, the Buffett Indicator also reached highs — although not as severe as the present 197% mark. At the time of the dot-com crash in 2000, the indicator reached levels of 140% — and during the 2008 financial crisis, it was at a level of 110%.

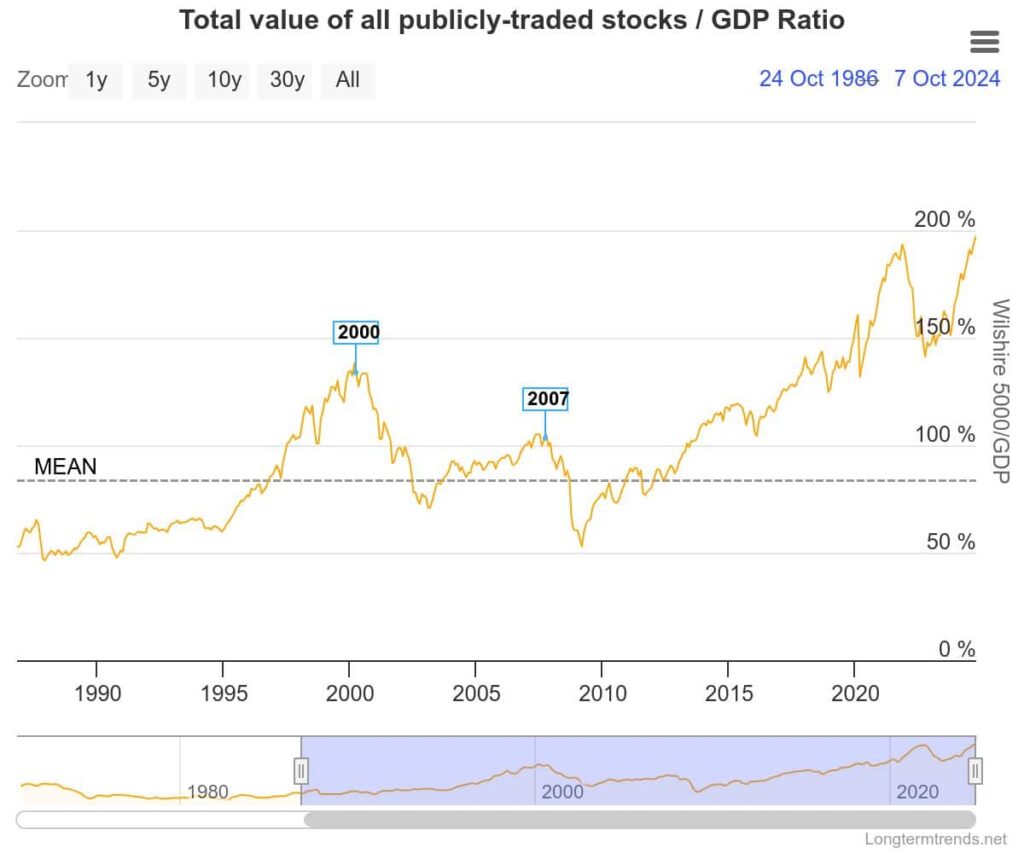
At press time, the indicator is at an all-time high of 197% — naturally, this can evoke panic, as terrible recessions followed suit at much lower levels. Buffett himself has previously cautioned that when levels close to 200% are reached, ‘you are playing with fire’, alluding to the potential for sharp market corrections.
This serves as a stark reminder of the importance of fundamentals — slower economic growth or faltering earnings might very well cause a market downturn.
Limitations of the Buffett Indicator
Although the present state of things does seem rather gloomy, it is important to note that the Buffett Indicator does have drawbacks and that the markets themselves have changed since the Oracle of Omaha first introduced the metric in a 2001 Fortune essay co-authored with journalist Carol Loomis.
First of all, it is widely held that the Buffett Indicator isn’t reliable in terms of market timing. It does signal when the market is overvalued or undervalued — but more as a broad measure rather than a precise tool for immediate decisions.
The indicator also relies on macroeconomic data — which is released quarterly and revised often, as seen with the recent September 2024 jobs report, further diminishing its predictive capabilities.
Finally, critics argue that the impact of globalization has had an outsized effect on the relevance of Buffett’s Indicator. Many of the largest publicly traded businesses in the United States, particularly the aforementioned tech companies, derive significant portions of their revenue from abroad — without adjusting the indicator, it follows that these increased valuations seem excessive when in reality, they might not be.
Taking everything into consideration, while it seems clear that the stock market is overvalued at the moment, the Buffett Indicator is best used as prescribed — as a general gauge. Other macro factors — a slowdown in growth, resurgent inflation, or even economic contraction are much more likely to be early warning signs of a recession, not the ratio of equity market cap to GDP.