
After Bitcoin (BTC) experienced a sharp correction on October 10, leading cryptocurrency analyst TradingShot has noted that the pattern closely echoes the price movements seen during the COVID-19 crash in March 2020.
The recent plunge, triggered by renewed trade tensions and tariff threats, has drawn attention from the trading expert, who suggested that Bitcoin’s technical setup could be laying the groundwork for a potential parabolic rally.
In an October 14 TradingView post, the crypto analyst highlighted that BTC’s latest decline mirrors the 2020 crash that preceded its historic bull run.
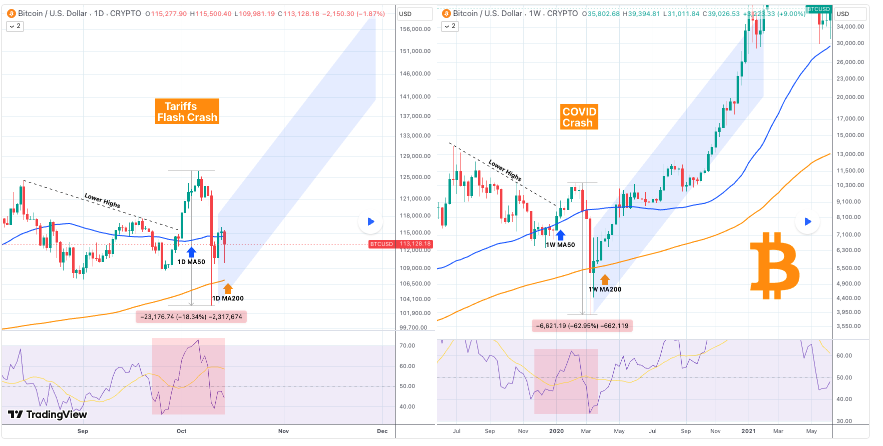
Although the current drop is smaller, about 18% compared to 63% during the pandemic, the technical structure remains similar.
On the daily chart, Bitcoin formed lower highs before briefly breaking upward, then fell below its 50-day and 200-day moving averages. This setup resembles the COVID-19 pattern on the weekly chart, where BTC also dipped under its 50-week and 200-week averages before a strong recovery.
In both cases, the Relative Strength Index (RSI) entered oversold territory, signaling seller exhaustion and potential for reversal.
At the same time, the 2020 crash demonstrated that maintaining candle closes above the MA200 marked a turning point for renewed bullish momentum.
Bitcoin’s key price levels to watch
Once Bitcoin reclaimed that level, it surged from under $5,000 to over $60,000 within a year.
If the current market follows a similar fractal, Bitcoin’s latest flash crash could represent the final shakeout before another major rally.
With the MA200 acting as a key support zone, analysts believe BTC could be positioning for a long-term move toward the $150,000 region, assuming historical trends repeat.
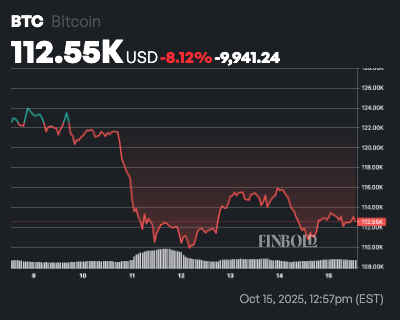
Since the sharp drop that pushed Bitcoin below $110,000, the asset has struggled to sustain a strong recovery, with $115,000 emerging as a key short-term resistance level.
Bitcoin price analysis
At press time, Bitcoin was trading at $112,562, up 1.2% in the past 24 hours but down 8% over the week. The price remains slightly below the 50-day SMA of $114,665, suggesting short-term weakness, yet comfortably above the 200-day SMA of $105,528, indicating that the broader uptrend remains intact.
The 14-day RSI stands at 44.34, reflecting mild bearish sentiment but not oversold conditions. This suggests that while short-term momentum is subdued, Bitcoin retains room for a rebound if it reclaims the 50-day SMA and rebuilds its bullish momentum above key support levels.
Featured image via Shutterstock