
Following XRP’s bullish run, driven by massive buying pressure, an analyst is cautioning that the asset may be due for a correction.
Indeed, cryptocurrency trading expert Michaël van Poppe noted that XRP’s rally, mainly fueled by the July 19 approval of the ProShares XRP Futures ETF, may have pushed the market into exhaustion, he said in an X post on July 20.
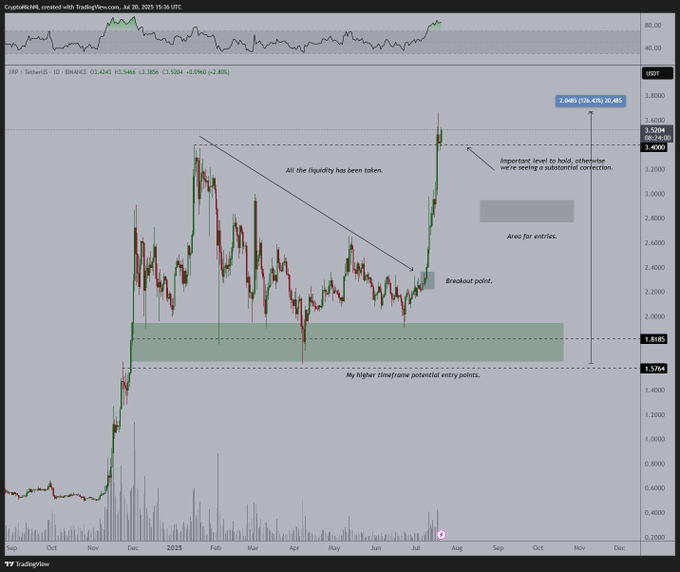
The ETF news acted as a key catalyst, reigniting interest in the altcoin and pushing its price above $3.40, a level not seen in years.
According to Poppe, the rally has likely exhausted much of the upward liquidity, indicating that XRP could soon enter a corrective phase. He emphasized that $3.40 is a critical level, warning that failure to hold above it could trigger a “significant correction.”
XRP price levels to watch
In such a scenario, he identified the $2.70 to $3 range as a potential accumulation zone. Additionally, the breakout zone near $2.20, which served as the launchpad for the recent surge, may come into focus.
If selling pressure intensifies, traders could look further down toward higher-timeframe support zones at $1.81 and even $1.57 for potential re-entry points.

Meanwhile, XRP’s momentum has also been bolstered by other fundamentals, such as the July 18 signing of the GENIUS Act into law. The legislation officially validated Ripple’s RLUSD stablecoin as compliant with U.S. regulatory standards, boosting RLUSD’s market cap and enhancing the utility of XRP, which serves as its settlement layer.
At the same time, anticipation is growing around the potential approval of a spot XRP ETF, alongside a rise in institutional interest. Notably, Teucrium’s leveraged 2x XRP ETF has reached $500 million in assets under management.
XRP price analysis
At press time, XRP was trading at $3.53, up about 1.5% in the last 24 hours and nearly 20% over the past week.
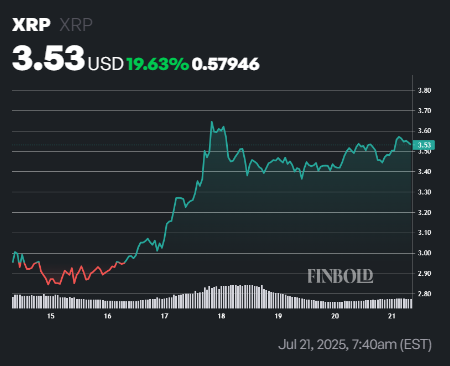
The asset is currently trading well above its 50-day simple moving average (SMA) of $2.40 and the 200-day SMA of $1.82, confirming strong bullish momentum. However, the 14-day Relative Strength Index (RSI) stands at 83.47, signaling overbought conditions and a possible short-term pullback despite the broader uptrend.
Featured image via Shutterstock