Skip to content

No results found

To keep going please Log in.

or

By submitting my information, I agree to the Privacy Policy and Terms of Service.

To keep going please Log in.

or

By submitting my information, I agree to the Privacy Policy and Terms of Service.

To keep going please Log in.

or

By submitting my information, I agree to the Privacy Policy and Terms of Service.

To keep going please Log in.

or

By submitting my information, I agree to the Privacy Policy and Terms of Service.

After massive sell-off, XRP just flashed signal for 30% move

After massive sell-off, XRP just flashed signal for 30% move
Paul L.

After enduring a sharp sell-off in recent sessions alongside broader market sentiment, XRP is showing early signs of a potential trend reversal, with technical indicators pointing to a possible 30% price move.

Analysis of the four-hour chart suggests that XRP had been consolidating within a symmetrical triangle pattern, a formation typically associated with tightening price action before a decisive breakout, according to insights shared by Ali Martinez in an X post on March 28.

XRP price analysis chart. Source: Ali Martinez

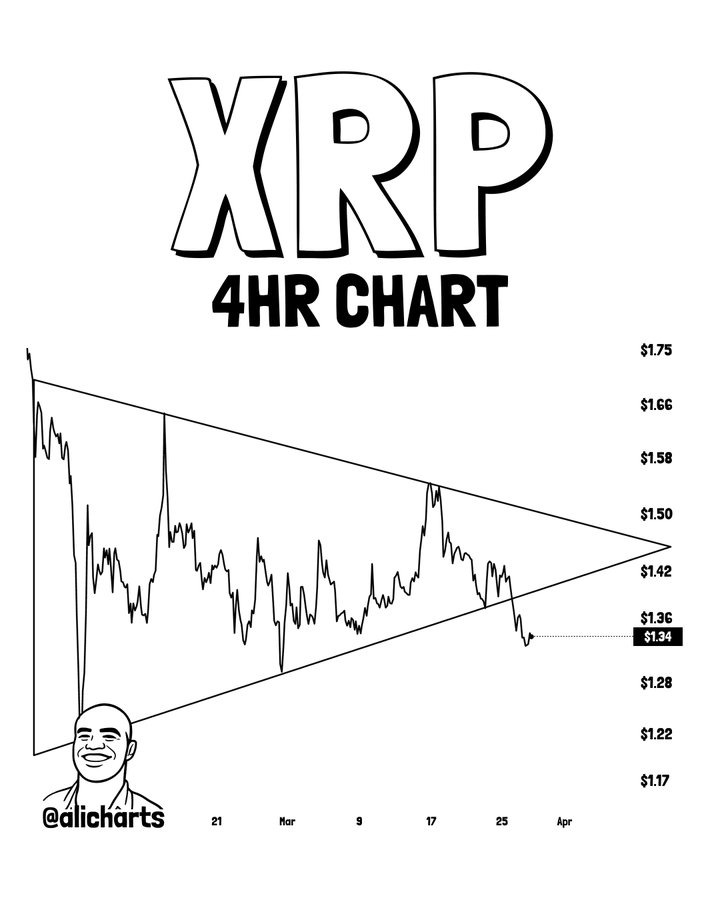
The structure, defined by a series of lower highs and higher lows, reflects a market caught between weakening bullish momentum and diminishing selling pressure. 

Notably, price action recently approached the apex of the triangle, hovering near the $1.34 to $1.36 range after failing to sustain a move above the upper resistance trendline near $1.50. 

The repeated rejections at higher levels, combined with declining volatility inside the pattern, suggest that a breakout was increasingly likely as the range narrowed.

Notably, XRP now appears to be breaking out of its consolidation pattern, signaling a potential shift in momentum following the broader market downturn. 

Such symmetrical triangle breakouts often lead to strong price expansion, with the move typically matching the pattern’s height, suggesting a possible 30% swing from the breakout level.

XRP price remains fragile

However, XRP sentiment remains fragile. The recent drop from around $1.50 to the mid-$1.30s points to a persistent selling pressure, even as XRP attempts to establish a new trend. 

If the breakout holds, the cryptocurrency could reclaim key resistance levels and revisit pre-correction highs. 

Conversely, failure to sustain momentum above the breakout zone could invalidate the setup, exposing XRP to further downside toward $1.28 or lower.

Overall, XRP has continued to trade under pressure this week. By press time, the asset was valued at $1.33, having declined about 0.65% in the past 24 hours. 

XRP seven-day price chart. Source: Finbold

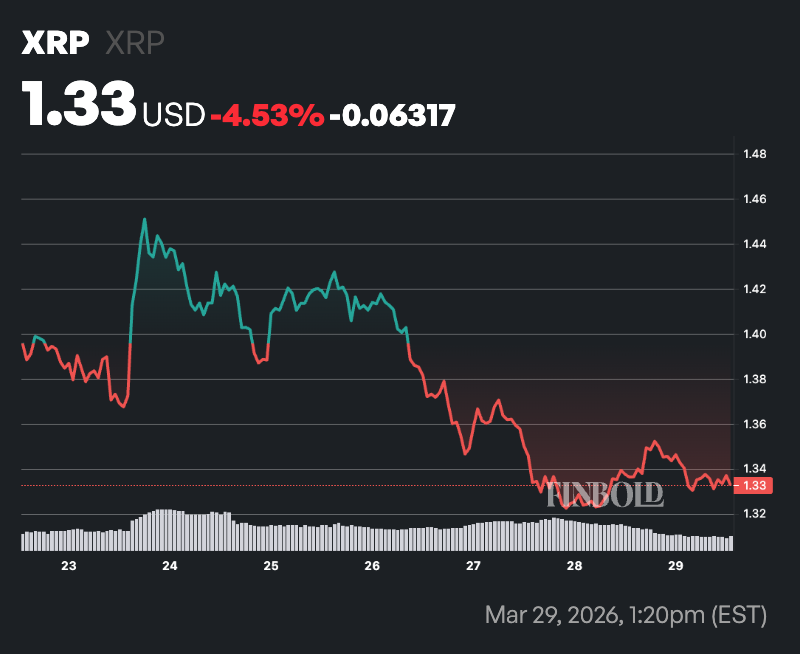
On the weekly timeframe, the asset is also down 4.5%. The token has been trading in a tight range between $1.33 and $1.35 in the short term, showing limited volatility but clear short-term bearish momentum. 

Featured image via Shutterstock


Best Crypto Exchange for Intermediate Traders and Investors

  • Invest in cryptocurrencies and 3,000+ other assets including stocks and precious metals.

  • 0% commission on stocks - buy in bulk or just a fraction from as little as $10. Other fees apply. For more information, visit etoro.com/trading/fees.

  • Copy top-performing traders in real time, automatically.

  • eToro USA is registered with FINRA for securities trading.

30+ million Users worldwide
Securities trading offered by eToro USA Securities, Inc. (“the BD”), member of FINRA and SIPC. Cryptocurrency offered by eToro USA LLC (“the MSB”) (NMLS: 1769299) and is not FDIC or SIPC insured. Investing involves risk, and content is provided for educational purposes only, does not imply a recommendation, and is not a guarantee of future performance. Finbold.com is not an affiliate and may be compensated if you access certain products or services offered by the MSB and/or the BD
Finbold Career

Join Finbold's newsroom, become a crypto reporter today!

Apply now to join Finbold as a crypto/finance news writer!

Latest posts

Finance Digest

By subscribing you agree with Finbold T&C’s & Privacy Policy

Related posts

Finbold AI Agent

How AI Price Predictions Work

We use cutting-edge AI models to forecast future prices for stocks and crypto.

Home

No results found

IMPORTANT NOTICE

Finbold is a news and information website. This Site may contain sponsored content, advertisements, and third-party materials, for which Finbold expressly disclaims any liability.

RISK WARNING: Cryptocurrencies are high-risk investments and you should not expect to be protected if something goes wrong. Don’t invest unless you’re prepared to lose all the money you invest. (Click here to learn more about cryptocurrency risks.)

By accessing this Site, you acknowledge that you understand these risks and that Finbold bears no responsibility for any losses, damages, or consequences resulting from your use of the Site or reliance on its content. Click here to learn more.