

Advanced Micro Devices (NASDAQ: AMD) could face a steep correction of more than 90% by early December 2029 if a long-term historical pattern repeats.
The bearish scenario, shared by TradingShot in a TradingView post on September 3, suggests AMD stock could plunge to approximately $53, representing a decline of about 90% from current levels at $577.
The projection is based on a recurring pattern that has appeared several times throughout AMD’s 54-year trading history.
The analysis highlighted that the technology firm has traded within a long-term ascending channel since 1972. In June 2026, the stock touched the upper boundary of that channel before entering a sideways phase.
According to the outlook, the last time AMD reached a similar position within the channel was in September 1984. That period was followed by a 91.21% crash that erased most of the stock’s gains.
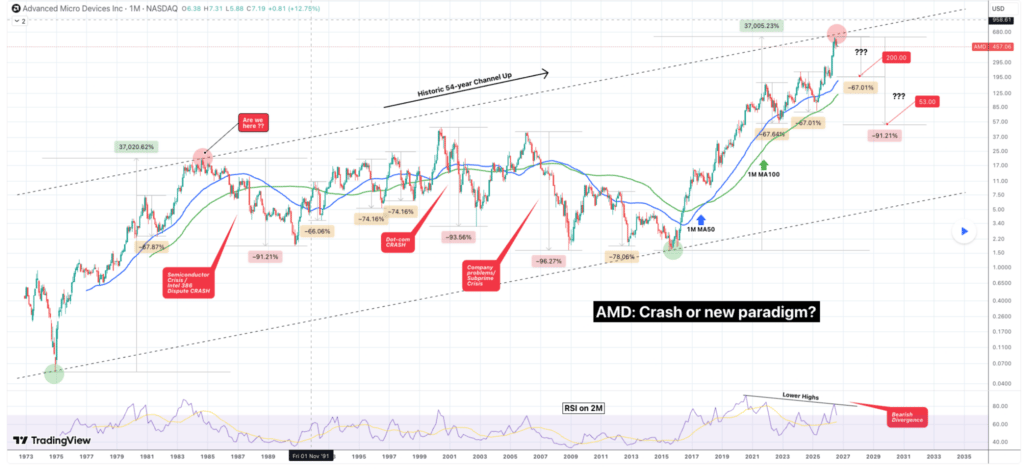
The analyst noted striking similarities between AMD’s current rally and its 1974–1985 advance. Both bull runs lasted roughly 11 years and generated gains exceeding 37,000%. In both cases, AMD repeatedly found support at its monthly 50-period and 100-period moving averages.
AMD’s failing momentum
Adding to the cautionary outlook, the chart shows a bearish divergence on the two-month Relative Strength Index (RSI). While AMD recently reached new highs, momentum has failed to confirm the move, a signal often associated with weakening bullish trends.
TradingShot’s analysis also points to several severe drawdowns throughout AMD’s history.
Beyond the 1985 collapse, AMD suffered a 93.56% decline during the dot-com crash between 2000 and 2002. The stock also plunged 96.27% between 2006 and 2008 ahead of the global financial crisis.
Even outside major market crashes, AMD has repeatedly recorded declines ranging from roughly 66% to 78%. More recently, corrections in 2022 and 2024–2025 both approached 67%, with the latter finding support near the monthly 100-period moving average before the current rally began.
Based on those historical patterns, the analyst outlined two possible downside scenarios.
The first and more moderate outcome would see AMD decline about 67%, bringing the stock toward $200, a level that aligns with the monthly 100-period moving average highlighted on the chart.
The second, and far more bearish scenario, would involve a repeat of the 1985-style collapse, sending AMD to approximately $53 by early December 2029.
AMD stock fundamentals
While the chart points to elevated downside risk, AMD’s business performance remains robust.
The company reported record second-quarter 2026 revenue of $11.5 billion, up 50% year over year, driven primarily by explosive growth in its Data Center segment. Data Center revenue surged 107% to $6.7 billion, accounting for about 58% of total sales.
AMD has also secured major AI infrastructure partnerships with companies including Meta, Anthropic, and Microsoft, strengthening its position in the rapidly expanding artificial intelligence market.
For the third quarter of 2026, AMD expects revenue of approximately $13 billion, reflecting continued strong demand for its EPYC processors and Instinct AI accelerators.
As a result, historical patterns do not guarantee a repeat of previous crashes. Unlike the 1980s, AMD now operates a significantly broader business with stronger technology assets, expanding AI exposure, and a more diversified product portfolio.
Featured image via Shutterstock