
As Bitcoin (BTC) recovers from Tuesday’s sharp sell-off, a trading expert has outlined a path that could push the flagship cryptocurrency to a new all-time high.
Based on historical price patterns, Bitcoin could rise to $145,000 by September 2025, according to a June 18 post on TradingView by TradingShot
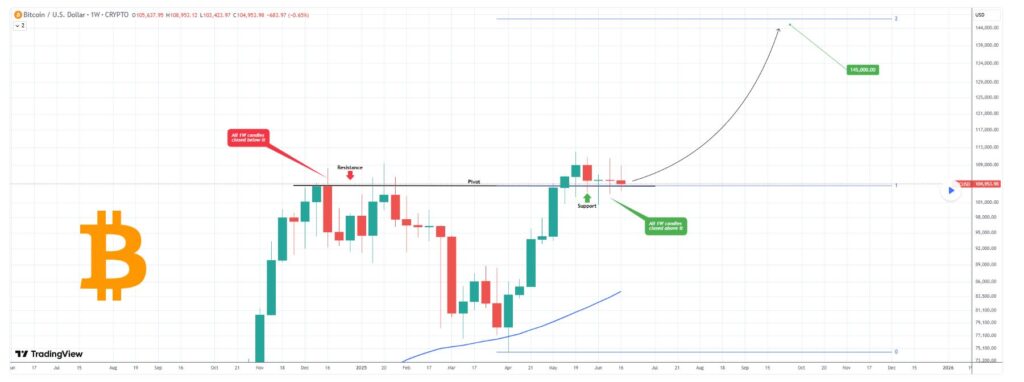
The analysis highlighted the weekly timeframe as a key bullish signal, with Bitcoin closing five consecutive weekly candles above an important pivot trendline. This same level acted as strong resistance between December 9, 2024, and January 27, 2025, when all weekly closes remained below it.
In contrast, recent candles have closed above the trendline, suggesting a change in market structure. The past two weekly candles were nearly flat, showing market consolidation led by a balance between buyers and sellers.
Bitcoin’s possible 40% rally
Using Fibonacci analysis, TradingShot set the 1.0 level at the pivot line, projecting the 2.0 extension just above $145,000, an almost 40% rally from the current prices.
The positive outlook comes shortly after Bitcoin faced a notable downturn amid rising geopolitical tensions involving Iran. As reported by Finbold, the asset led a broader market sell-off during this time.
However, institutional interest remains strong. Spot Bitcoin ETFs have recorded over $1.46 billion in inflows since June 9, according to on-chain data from Santiment as of June 17, signaling continued confidence despite recent volatility.
Bitcoin price analysis
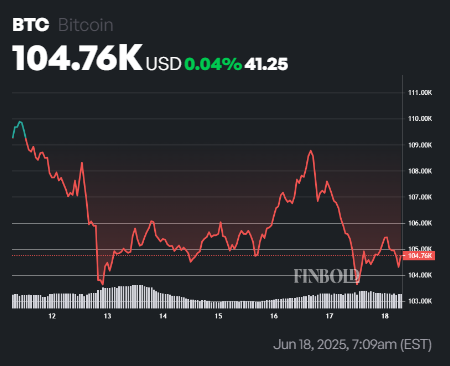
By press time, Bitcoin had reclaimed the $104,000 resistance level, trading at $104,760, up nearly 1% on the day. On a weekly basis, the asset is down a slight 0.1%.
Short-term indicators hint at further gains. Bitcoin is trading just above its 50-day simple moving average (SMA) of $104,236, while the 200-day SMA sits at $87,557, confirming a strong long-term uptrend.
Meanwhile, the 14-day Relative Strength Index (RSI) stands at 50.63, reflecting neutral momentum with no signs of overbought or oversold conditions.
Featured image via Shutterstock