The following guide will examine Fibonacci retracement and how it’s derived from the Fibonacci sequence. Additionally, it will explain how to understand it on charts and interpret those findings, as well as the pros and cons of using this technical analysis tool.
Highly Rated Stock Trading & Investing Platform
-
Invest in stocks, ETFs, options and crypto
-
Copy top-performing crypto-traders in real time, automatically.
-
0% commission on buying stocks - buy in bulk or just a fraction from as little as $10. Other fees apply. For more information, visit etoro.com/trading/fees.
-
eToro USA is registered with FINRA for securities trading.
What is the Fibonacci sequence?
The Fibonacci numbers were first described as early as 200 B.C. in Indian mathematics in connection with Sanskrit prosody (the study of poetic meters and verse), particularly in works by Pingala. However, the most explicit description of the sequence emerges in the work of Acarya Virahanka. He is an Indian prosodist credited as having developed Fibonacci numbers and their sequencing method around 600 A.D.
The Fibonacci sequence was introduced to the West by Italian mathematician Leonardo of Pisa, commonly known as Fibonacci, in his 1202 book Liber Abaci. In the book, he calculates the growth of idealized (biologically unrealistic) rabbit populations, which popularized the concept in Europe. Therefore, the Fibonacci sequence bears his name.
Recommended video: The Fibonacci Sequence – Nature’s Code
Keep reading to learn how to apply the Fibonacci retracement to your trading strategy.
Investing for beginners:
- What is Investing? Putting Money to Work
- 17 Common Investing Mistakes to Avoid
- 15 Top-Rated Investment Books of All Time
- How to Buy Stocks? Complete Beginner‘s Guide
- 10 Best Stock Trading Books for Beginners
- 15 Highest-Rated Crypto Books for Beginners
- 6 Basic Rules of Investing
- Dividend Investing for Beginners
- Top 6 Real Estate Investing Books for Beginners
Fibonacci sequence and the golden ratio
The golden ratio (often denoted by the Greek letter φ), also known as the golden section, golden mean, or divine proportion, is a mathematical ratio equal to (1+√5)/2, or approximately 1.618. A golden ratio is an irrational number, meaning a fraction of integers or whole numbers cannot express it.
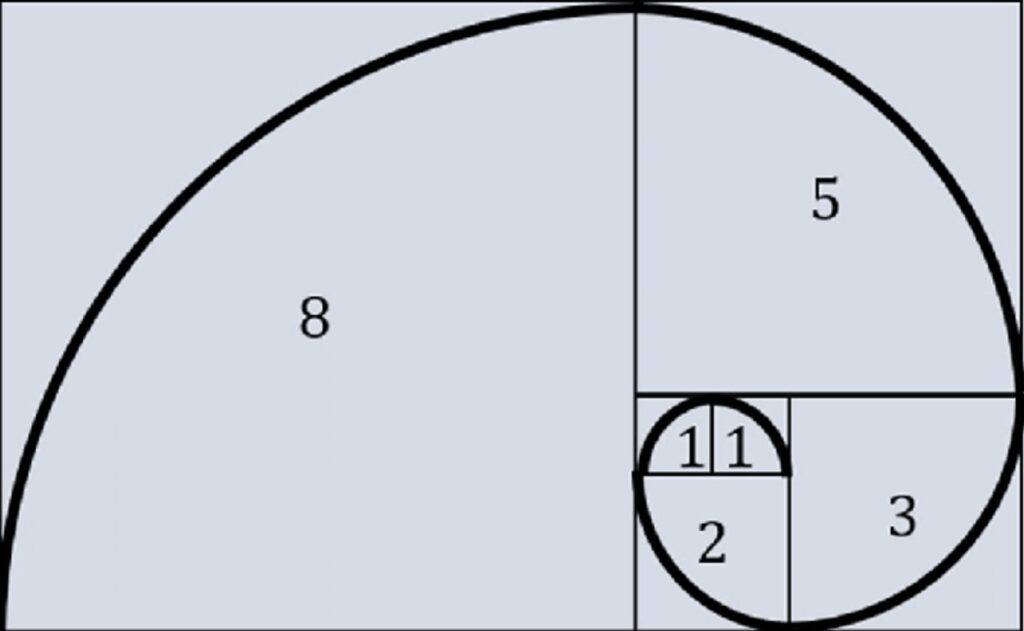
The golden ratio and the Fibonacci sequence give birth to the golden spiral. It is a logarithmic spiral that grows outward by a factor equivalent to the golden ratio. Essentially, the golden spiral gets wider (or further from its center point) by a factor of φ for every quarter turn it makes.
It occurs in some patterns in nature, including the pentagonal form of some flowers, the spiral of a nautilus shell, as well as the shape of hurricanes or galaxies. Moreover, its elegant aesthetic disposition has cemented it as a fundamental element in art, architecture, and design. For example, the Parthenon in Athens, the Great Pyramid in Giza, and Da Vinci’s “The Last Supper” all incorporate rectangles the dimensions of which lie in the golden ratio.
Furthermore, the frequent application of the golden ratio in trading analysis creates something akin to a self-fulfilling prophecy. In other words, the more people utilize Fibonacci-based trading methods, the more effective they become.
Highly Rated Stock Trading & Investing Platform
-
Invest in stocks, ETFs, options and crypto
-
Copy top-performing crypto-traders in real time, automatically.
-
0% commission on buying stocks - buy in bulk or just a fraction from as little as $10. Other fees apply. For more information, visit etoro.com/trading/fees.
-
eToro USA is registered with FINRA for securities trading.
Fibonacci ratios
Importantly, when we take any two successive Fibonacci numbers, as the numbers increase, the quotient between each consecutive pair consistently yields the golden ratio – approximately 1.618, or its inverse 0.618 (61.8%).
By dividing any number with the second one to its right, you’ll get a result of 0.382 or 38.2%; by dividing one with the third to its right, you’ll get a 0.2360 or 23.6%, and so on.
Fibonacci retracement levels
Technical traders use Fibonacci ratios to determine retracement levels. The Fibonacci retracement levels are:
- 23.6%;
- 38.2%;
- 61.8%;
- 78.6%.
Although not officially a Fibonacci ratio, 50% is also used.
All the percentages (except for 50%) stem from some mathematical calculation involving the Fibonacci sequence.
Fibonacci retracement formula
Fibonacci retracement levels do not have formulas. Instead, a Fibonacci retracement is created by taking two extreme points (e.g., a peak and a trough) on a chart and dividing the vertical distance by the key Fibonacci ratios.
Recommended video: How to trade Fibonacci retracements
How to use Fibonacci retracement?
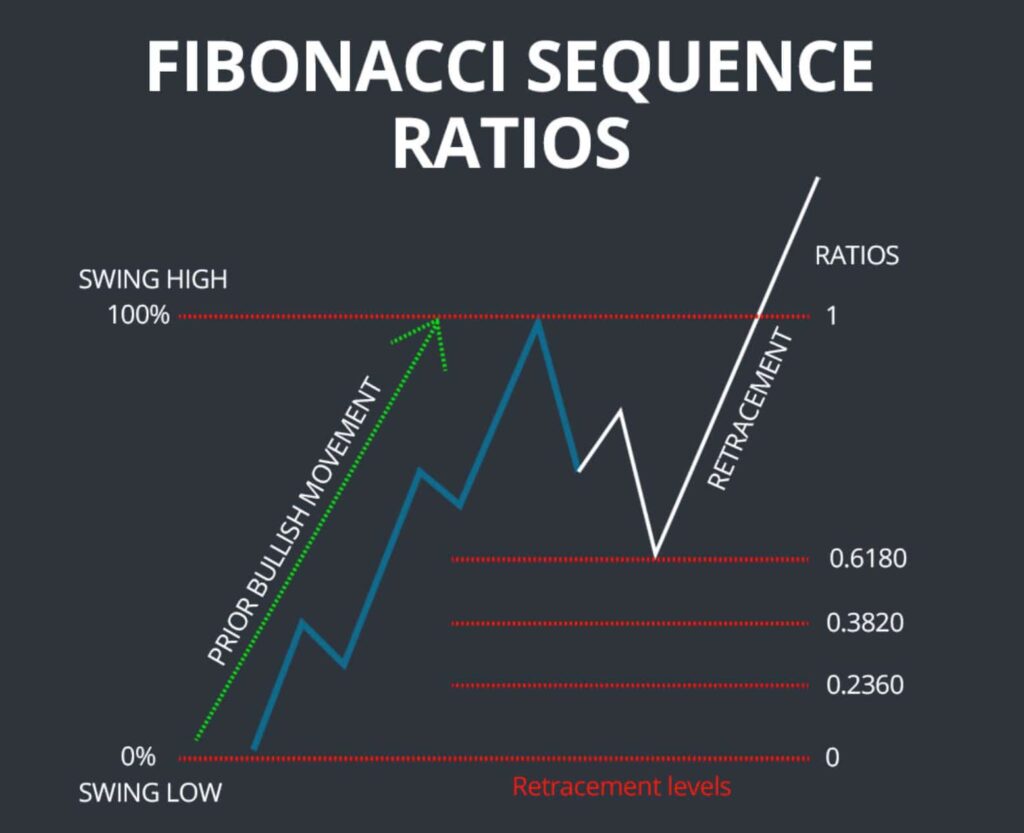
Fibonacci retracement levels are created by dividing the vertical distance between the high and low points by the key Fibonacci ratios. You can visualize it by drawing horizontal lines on the trading chart at 0.0%, 23.6%, 38.2%, 50%, 61.8%, and 100%. Though not an official Fibonacci ratio, traders also like to use the 50.0% ratio because often, the price will retrace by around 50% before continuing its original trend.
Fibonacci retracement levels serve to:
- Identify support and resistance levels;
- Place stop-loss orders;
- Set target prices;
- Act as a primary mechanism in countertrend trading (a swing trading strategy that attempts to make small gains by trading against the prevailing trend).
Traders can use this tool across various asset classes, including foreign exchange, stocks, commodities, cryptocurrencies, futures, options, and index funds.
Moreover, it applies to all timeframes, including day trading and long-term investing. However, as with most technical indicators, the predictive value of the Fibonacci retracement is proportional to the time frame, with greater weight given to longer timeframes. For example, a 61.8% retracement on a weekly chart will provide a far more reliable signal than a 61.8% retracement on a five-minute chart.
Additionally, Fibonacci levels play a role in other areas of technical analysis. For example, they are prevalent in Gartley patterns (chart patterns based on Fibonacci ratios) and Elliott Wave theory (examining long-term trends in price patterns and how they correspond with investor sentiment).
Fibonacci retracement example
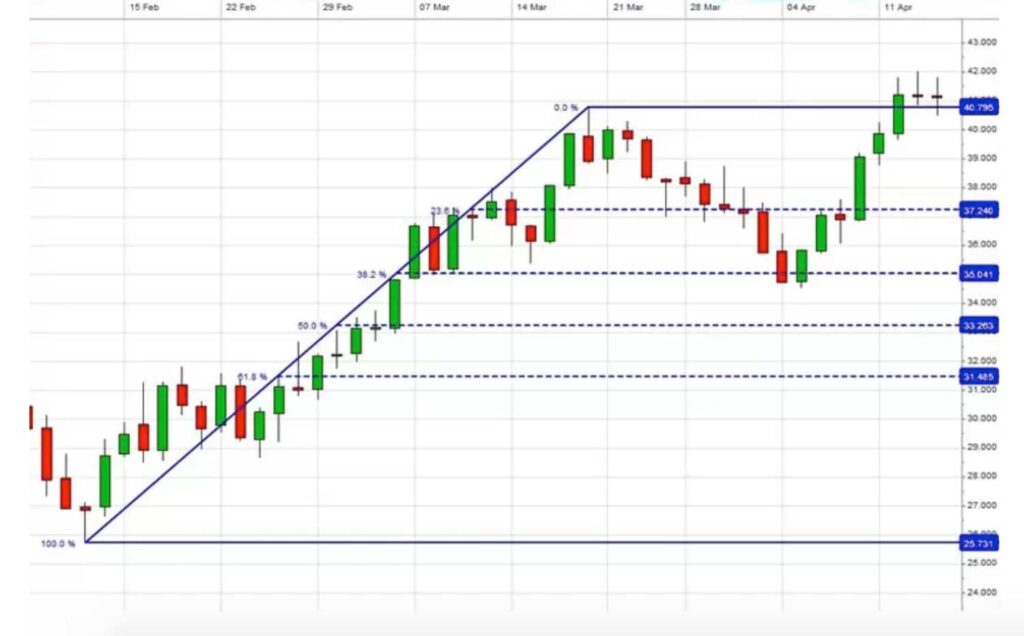
When a stock is trending up or down, it usually pulls back slightly before continuing the trend. Often, it will retrace to a steady Fibonacci retracement level, such as 38.2% or 61.8%. These levels offer new entry or exit positions in the direction of the original trend. Remember, the strategy works best in strongly trending markets.
In short, traders will look at Fibonacci ratios to determine where the market will resume its previous rise or fall. So, for example, during an uptrend, you might go long (buy) on a retracement down to a firm support level (61.8% in the example below).
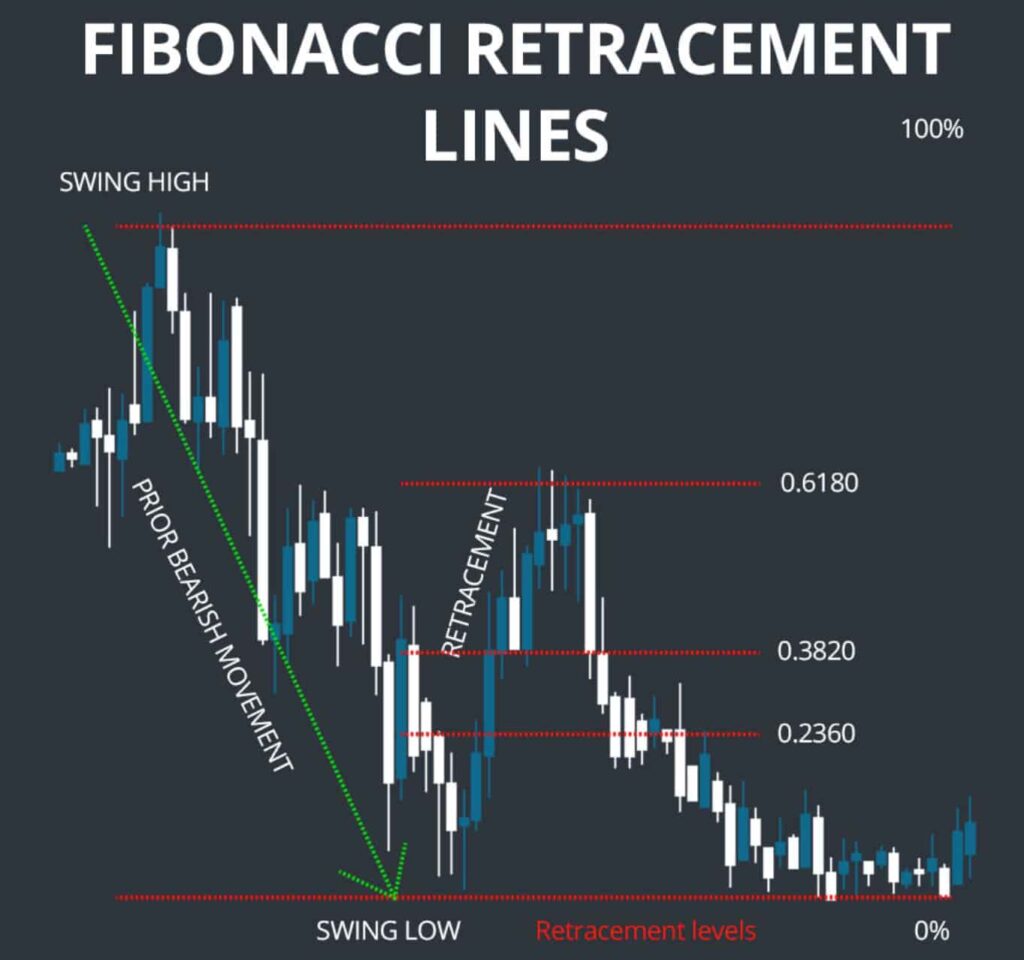
Conversely, in a downtrend, you could go short (sell) once the stock returns to its key resistance level (61.8% in the example below).
Fibonacci retracement vs. extension
While Fibonacci retracement levels can help traders find entry (or exit) points in hopes of catching the resumption of an initial trend, Fibonacci extensions can complement this strategy by giving traders Fibonacci-based profit targets or estimate how far a price may travel after a pullback concludes.
As an illustration, a stock begins at $10 and soars to $15 before slipping back to $12.5. The move from $15 to $12.5 is a retracement. If the price starts rallying and reaches $20, that is an extension.
Fibonacci trading strategies
Fibonacci retracement lines typically function as part of trend-trading strategies. For example, suppose the market is experiencing a pullback within a prevailing trend. In that case, you can take advantage of the levels the Fibonacci sequence defines and place your trade in the direction of the underlying movement.
Conversely, the Fibonacci levels can be a lifesaver for traders who have missed the boat on an upswing. Fortunately, they allow them to fix the mistake by biding their time and waiting for a market correction. By plotting Fibonacci ratios like 61.8%, 38.2%, and 23.6% on a chart, traders can discover potential retracement levels to enter profitable trades.
Fibonacci retracement and other technical indicators
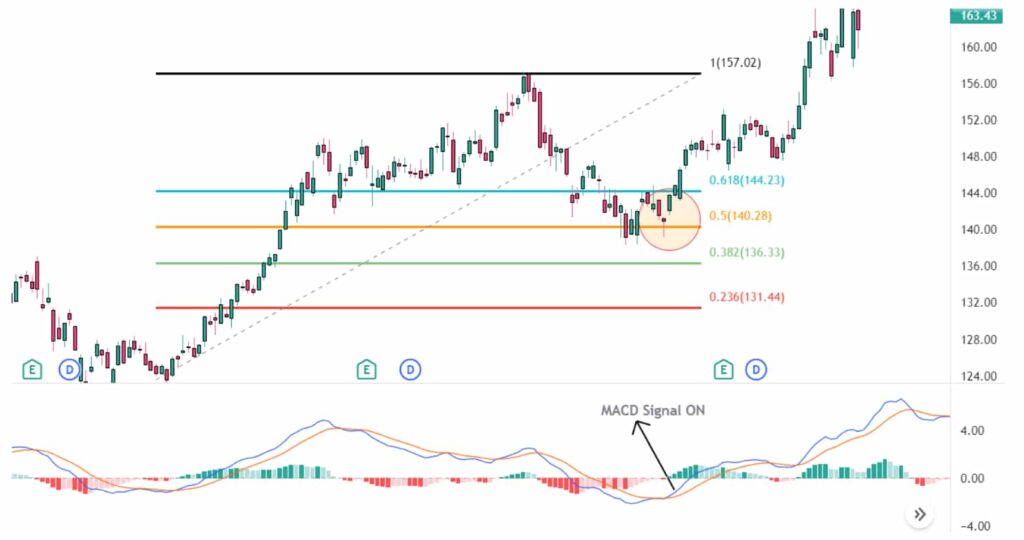
Additionally, Fibonacci levels find use in combination with various technical indicators, including:
- MACD indicator: This method seeks to identify a cross-over of the MACD indicator (signal line crossing over/under the MACD line) when an asset’s market price reaches a predefined Fibonacci level. When this happens, investors can place a trade in the direction of the trend.
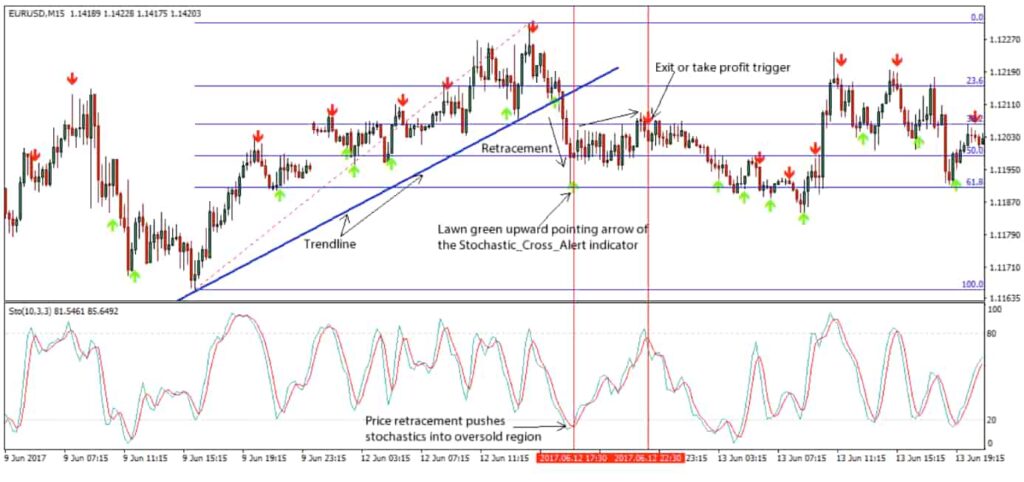
- Stochastic oscillator: This two-line indicator is an invaluable tool that can assist in identifying both overbought and oversold levels. In turn, this can be used to forecast trend reversals. The strategy looks to match bounces off the price with overbought/oversold signals of the stochastic. The two signals together indicate an opportunity to open a position.
To maximize the profitability of Fibonacci retracement levels, traders incorporate them into a larger technical analysis strategy. By leveraging multiple and diverse indicators, you can identify market trends with improved accuracy, increasing the profit potential. As a rule, the more indicators to support a trade signal, the stronger it is.
Pros and cons of Fibonacci retracements
Like most other technical analysis tools, the Fibonacci retracement also comes with its own distinct advantages and disadvantages. To fully harness this technical indicator in your trend-trading strategy, it’s essential to understand where it triumphs and where it can fall short.

Pros
- A means of identifying support and resistance levels: Fibonacci retracements can be employed to corroborate suspicions about market trends;
- A way to detect entry and exit points: Support and resistance levels can indicate potential bullish or bearish market trends and suggest good times to open or close a position;
- Straightforward: Fibonacci retracement levels are fixed and easily recognizable. Moreover, they don’t require any calculations;
- Versatile: Fibonacci retracement works with various technical indicators.

Cons
- Subjective nature: Some traders feel that Fibonacci retracements are a self-fulfilling prophecy. If traders observe and act on the same Fibonacci ratios (or other technical indicators), orders will congregate around the same price levels, pushing the price in the desired direction;
- No guarantees: While the retracement levels can provide insight into where the price might find support or resistance, they do not guarantee that the price will stop there. Therefore, it is essential to use additional indicators to confirm the information;
- Difficult to identify the correct level: Because there are so many different Fibonacci levels, the price will likely reverse near one of them quite often. Unfortunately, traders often find it challenging to determine which level is the most useful at any given time;
- Obscure: The basis for any Fibonacci tool is an uncanny numerical pattern. For example, the ratios that are the basis of the Fibonacci retracement are derived from the Fibonacci sequence and are only the creation of a mathematical process. While that does not make Fibonacci trading inherently unreliable, it can be uncomfortable for traders who want to understand the rationale behind the method.
In conclusion
Fibonacci retracements are a widespread technical analysis tool used to predict future turning points in the financial markets. Based on previous market behavior, skilled traders can plot Fibonacci retracements and ratios to uncover potential support and resistance levels. By leveraging this instrument, they can anticipate where prices may go next more accurately.
Nevertheless, it is crucial to recognize that Fibonacci lines are merely a confirmation tool. As a result, employing this indicator alongside other technical analysis devices is highly recommended. Generally, the more confirming factors present, the more robust and reliable a trade signal will likely be.
Disclaimer: The content on this site should not be considered investment advice. Investing is speculative. When investing, your capital is at risk.
FAQs about Fibonacci retracements
What is the Fibonacci sequence?
The Fibonacci sequence is a series of numbers in which each number is the sum of the two preceding numbers, starting with 0 and 1. Therefore, the sequence goes 0, 1, 1, 2, 3, 5, 8, 13, 21, 34, 55, 89, 144, etc.
How are the golden ratio and the Fibonacci sequence related?
The Fibonacci sequence can be used to approximate the golden ratio, as the ratio of any two consecutive Fibonacci numbers is very close to the golden ratio of 1.618.
What are the Fibonacci ratios?
The Fibonacci ratios stem from the mathematical relationships in the Fibonacci sequence. They produce the following ratios: 23.6%, 38.2%, 61.8%, 78.6%, 100%, 161.8%, 261.8%, and 423.6%. Although 50% is not a pure Fibonacci ratio, traders usually include it.
How to draw Fibonacci retracement on a chart?
The Fibonacci retracement is formed by connecting the peak and a trough point of a security on a chart and splitting the vertical distance by the Fibonacci ratios.
How to use Fibonacci retracement?
When a stock is trending up or down, it usually pulls back slightly before continuing the trend. In fact, it will often retrace to a Fibonacci retracement level, which can indicate an entry or exit point in the direction of the original trend.
What is the best time frame for Fibonacci retracement?
Traders can use Fibonacci retracement patterns on any timeframe. However, they are more effective when viewed on longer timeframes, such as weekly or monthly charts.
Is Fibonacci retracement accurate?
The Fibonacci retracement’s effectiveness largely depends on how it’s used in conjunction with other technical analysis tools and market conditions. While some traders find the indicator useful for identifying potential support and resistance levels, others view them as more subjective.
What is the difference between Fibonacci retracement and extension?
Fibonacci retracement and extension are technical tools for predicting price movements. Retracement identifies potential support and resistance levels within a price move, indicating possible reversal points. Extension, conversely, predicts future price direction beyond the original move, providing targets for exits or continuation. Each tool applies differently to price charts for strategic trading insights.
Highly Rated Stock Trading & Investing Platform
-
Invest in stocks, ETFs, options and crypto
-
Copy top-performing crypto-traders in real time, automatically.
-
0% commission on buying stocks - buy in bulk or just a fraction from as little as $10. Other fees apply. For more information, visit etoro.com/trading/fees.
-
eToro USA is registered with FINRA for securities trading.