While Nvidia (NASDAQ: NVDA) is one of the best-performing stocks of 2024 at the time of publication, an increasing number of analysts and investors are worried that the stock’s two-year rally may soon come to an end. On September 4, the company saw a record $279 billion loss in market cap.
Valuation concerns have followed the stock’s rise throughout the year — now, after it has reached a new all-time high (ATH) of $140, many suspect that a correction is imminent. One researcher in particular has highlighted a bearish signal on Nvidia’s stock chart.
Technical analyst points out bearish NVDA stock chart pattern
Technical analyst Alan Santana observed that Nvidia stock has formed a double-top pattern on a year-to-date (YTD) chart in a TradingView post published on Monday, October 21.
Picks for you
The double top is a bearish reversal pattern that is formed when two highs happen in close proximity to one another, with a marked decline in between. In this case, Santana pointed to NVDA stock’s June 20 peak of $139.80, together with the recent October 17 peak of $140. In the period between these highs, Nvidia shares had dropped as low as $92.23.
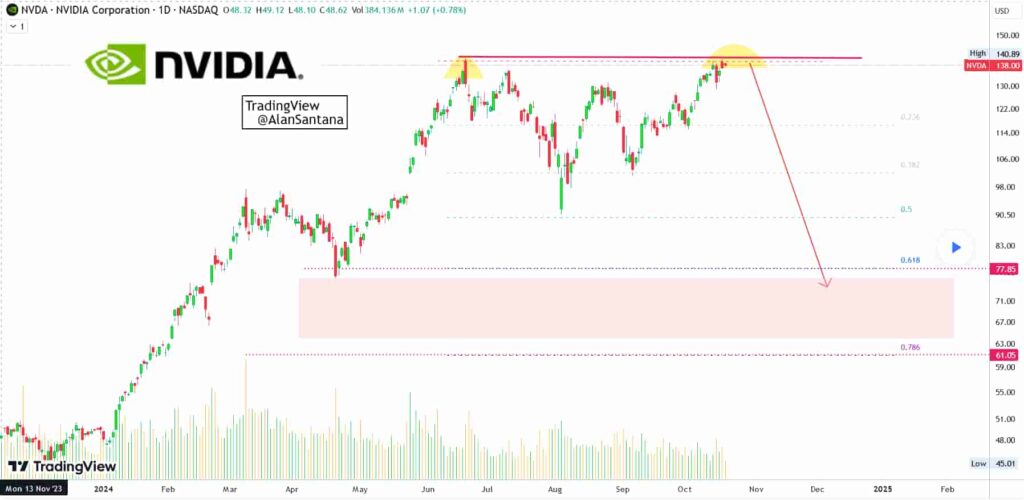
Santana also outlined several factors to bolster his bearish case — both of the highs closed red, and the latest high was preceded by a bearish signal — two sessions prior, a bearish engulfing candle was printed on the chart.
To boot, trading volume has consistently been decreasing since the first high — this most recent surge is followed by a pretty clear case of bearish volume divergence. Finally, the trading expert emphasized that the stock is trading at the strongest possible level of resistance — an all-time high, and one that had previously been tested unsuccessfully.
The analyst concluded with a simple message — now is a good time to take profits, and once the crash, which he expects is due in the coming weeks or months, occurs, investors should enter a long position at or near support.
Long term outlook for NVDA
While the chart pattern is clear and appears legitimate, it’s important to remember that chart patterns are by no means foolproof. While the semiconductor company has seen a massive increase in valuation, the growth is driven by real, increasing demand in booming sectors such as data centers and AI.
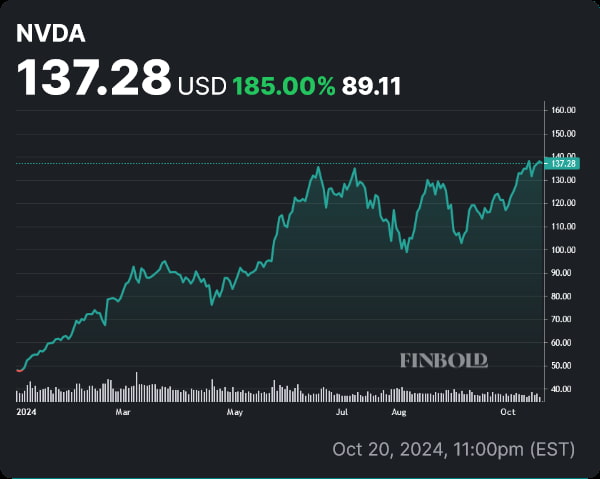
At press time, NVDA shares are trading at $137.28 — having surged by 18.08% over the last 30 days to bring YTD returns up to 185%.
The stock market does not function purely on the basis of technical analysis. NVDA might well be overpriced, as the company is now worth 11.7% of the U.S. GDP, and a correction might be due any day now — but this is unlikely to deter investors from an expanding business that controls a commanding share of its market and continues to deliver cutting edge solutions.
Wall Street equity researchers disagree with Santana — while no investment firm outright denies the possibility of a short-term correction, most are quite bullish in the long term. On October 14, Citi (NYSE: C) raised its price target to $150 — as did Morgan Stanley (NYSE: MS). Cantor Fitzgerald is even more optimistic — having set a price target of $175. Finally, Vivek Arya of BofA Securities reiterated his buy rating, raising his target from $165 to $190.
In any case, we will soon see whether Santana’s estimate is correct — if resistance is breached, this would certainly invalidate the pattern — although it would not remove the possibility of a short-term correction. For investors who are not too keen on short-term trades or technical analysis, Nvidia’s next earnings call, due November 19, will provide a much clearer view of the stock’s fundamentals.