
Recent bullish opinions surrounding Bitcoin (BTC) have faded as the cryptocurrency has seen a significant drop in price following geopolitical tensions in the Middle East.
Investor sentiment is in a state of flux — with many openly questioning theses such as the decentralized currency’s role as a substitute for gold as a hedge.
Vocal bulls are still highlighting the fact that recent factors — such as the best September in history, as well as a strong Chinese Yuan could serve to either recover lost ground in terms of price action or even lead to parabolic breakouts to the upside.
In times of uncertainty, traders would be wise to consider additional factors — keeping catalysts and geopolitical events in mind but supplementing them with technical analysis.
Bitcoin in a descending channel?
In an X post on October 3, cryptocurrency analyst Ali Martinez shared a year-to-date (YTD) Bitcoin chart suggesting that the cryptocurrency is in a descending parallel channel — a formation that could herald further drops in price if confirmed.
At press time, BTC is trading at $60,910 — shedding 0.83% on the daily chart to supplement weekly losses of 5.59%.
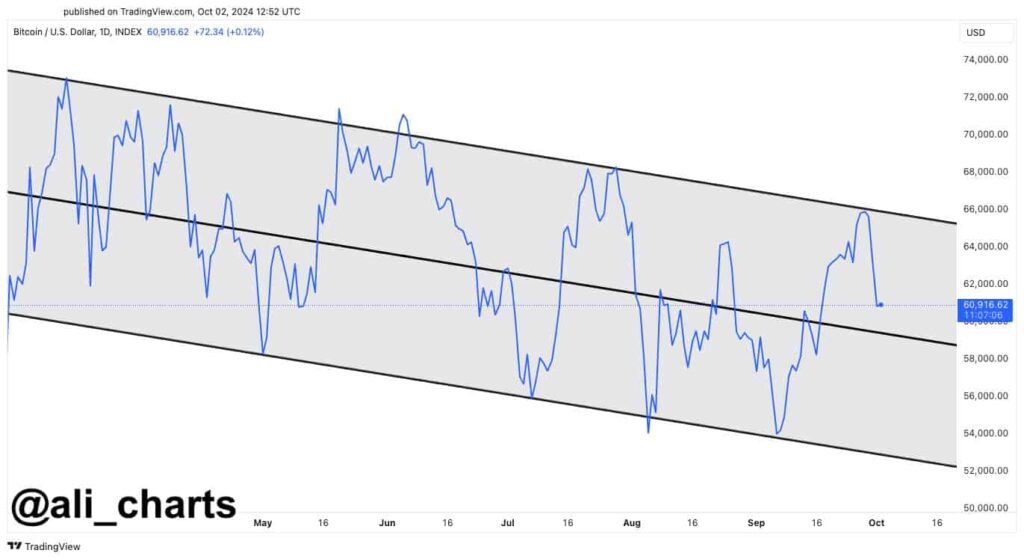
A bearish chart pattern, the descending parallel channel is characterized by the telltale sign of a downtrend — lower highs and lower lows. In his post, Martinez suggested that confirmation of the pattern could see prices reach the lower end of the channel, at the $52,000 mark.
As a key support zone close to a psychological threshold, the price point of $52,000 represents an area of great interest. Reaching that point would further drive bearish sentiment — while further downward moves would very likely cause a wider selloff and profit-taking, with the next key support level most likely at the psychologically important $50,000 level.
Traders should not rush to conclusions, however. Bitcoin is notorious for sudden, sharp reversals — if one were to occur, it would invalidate the pattern, and the resulting sentiment shift could see the upper channel breached. It should be noted that this would likely require the emergence of a new, positive catalyst — institutional interest, positive macroeconomic factors, or regulatory changes.
In the short term, traders should pay close attention to volume — significant moves towards the downside on strong volume would serve as additional confirmation for the pattern.
Conversely, moves to the downside on low volume would suggest that the bears are losing steam, while strong volume and positive price action could see bullish traders building strong momentum and regaining control.