
Legendary trader Peter Brandt believes Bitcoin (BTC) might be on the brink of a major breakout, drawing parallels to a significant stock market surge in the mid-1980s.
According to Brandt, BTC mirrors historical patterns that preceded a prolonged bull market, suggesting Bitcoin could follow a similar trajectory.
In an X post (formerly Twitter), renowned trader Peter Brandt highlighted a striking similarity between a current Bitcoin chart and a pattern observed in the stock market during the mid-1980s, a period marked by a significant breakout.
Brandt focuses on the Bitcoin versus M1 money supply chart (BTC/WM1NS), which compares Bitcoin’s value against the total money supply in the US economy.
According to Brandt, the BTC/WM1NS chart mirrors a pattern seen about four decades ago when the Dow Jones Industrial Average (DJIA) ignited a bull market, ending the stagflation era of the 1970s.
The bullish pattern: Inverted head and shoulders
Brandt highlights that the BTC/WM1NS chart exhibits an inverted head and shoulders pattern. This bullish formation indicates that buyers are no longer waiting for the price to revisit lows before entering the market.
If the BTC/WM1NS chart witnesses a breakout, it would suggest that Bitcoin’s value is significantly outpacing the growing amount of US dollars.
During the 1970s, the DJIA exhibited a pattern that Brandt believes is now mirrored in Bitcoin’s performance against the increasing supply of US dollars.
The similarities in chart structure to the DJIA during the 1970s are striking, and the continuation of this inverted head and shoulders pattern could signal an impending major breakout for Bitcoin.

TechDev’s supporting analysis
Adding to the bullish sentiment, a crypto strategist TechDev, believes that BTC is gearing up for a significant price explosion. TechDev notes that Bitcoin’s trading range on the five-day chart is at its tightest level in eight years.
The narrowing trading range suggests that an ensuing breakout will likely lead to steep and rapid rallies. He also highlights the BTC versus M1 money supply chart, recently witnessed a “textbook breakout.”
This breakout, TechDev asserts, could ignite a parabolic surge, potentially ending this cycle with a blow-off top similar to those seen during the 2017, 2015, and 2013 bull markets.
BTC price analysis
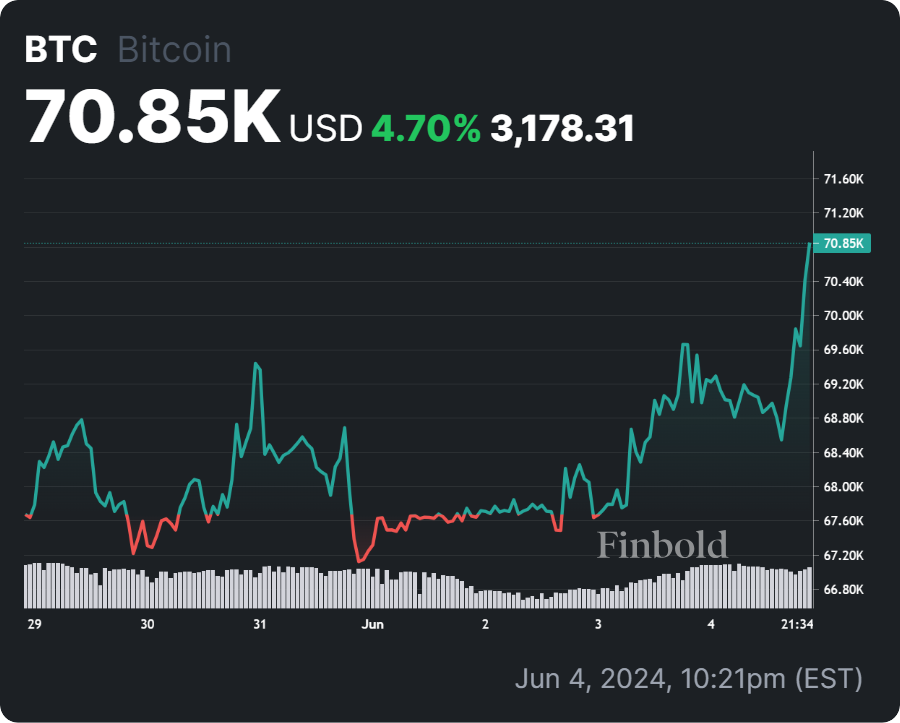
At press time, Bitcoin (BTC) is trading at $70,784, showing a 24-hour increase of 2.5%.
With patterns reminiscent of historical market breakouts and technical indicators suggesting bullish momentum, Bitcoin could be on the verge of a significant surge.
The next few months will be crucial in determining whether Bitcoin will meet these optimistic predictions and potentially reshape the financial landscape.
Disclaimer: The content on this site should not be considered investment advice. Investing is speculative. When investing, your capital is at risk.