Technical analysis (TA) can be a helpful tool for making investment decisions and increasing the profitability of your trades. Even though technical analysis follows predefined rules, the results can be interpreted in many ways and are often subjective. This guide offers an in-depth explanation of the technical analysis, clarifies its premises, and compares it to other methods. Moreover, it highlights how to master and use TA to your advantage to improve the profitability of your investments.
Best Crypto Exchange for Intermediate Traders and Investors
-
Invest in cryptocurrencies and 3,000+ other assets including stocks and precious metals.
-
0% commission on stocks - buy in bulk or just a fraction from as little as $10. Other fees apply. For more information, visit etoro.com/trading/fees.
-
Copy top-performing traders in real time, automatically.
-
eToro USA is registered with FINRA for securities trading.
What is technical analysis?
Historical price and volume data is visualized on charts which helps to identify specific patterns or trends occurring over a continuous period. That can be by the minute, hourly, daily, weekly, or over some other fixed period.
This technique is one of the two main ways to assess investment decisions along with fundamental analysis, which looks at factors such as a company’s fundamentals like revenue, profitability, industry competition, and the general economy to discover undervalued stocks.
Technical analysis maintains that the market price aready reflects all fundamental information, but that other variables, such as market sentiment, can influence pricing. For example, in financial markets, specific patterns in investors’ trading behavior may start to repeat over time. Thus, technical analysis can help account for these factors and thus predict future price movements.
A chart with price and trading volume data is thus a reflection of the market sentiment rather than fundamental factors. That is, it can help traders to forecast and assume what is likely to happen in the future by looking at past information.
Key points
2) In contrast, fundamental analysis focuses on the company’s financials;
3) Historical performance can be a solid indicator of future prospects.
4) Regardless of tools used, consistency, disciplined risk management, and understanding market context remain more important than any single indicator or strategy.
Investing for beginners:
- What is Investing? Putting Money to Work;
- 17 Common Investing Mistakes to Avoid;
- 15 Top-Rated Investment Books of All Time;
- How to Buy Stocks? Complete Beginner’s Guide;
- 10 Best Stock Trading Books for Beginners;
- 15 Highest-Rated Crypto Books for Beginners;
- 6 Basic Rules of Investing;
- Dividend Investing for Beginners;
- Top 6 Real Estate Investing Books for Beginners.
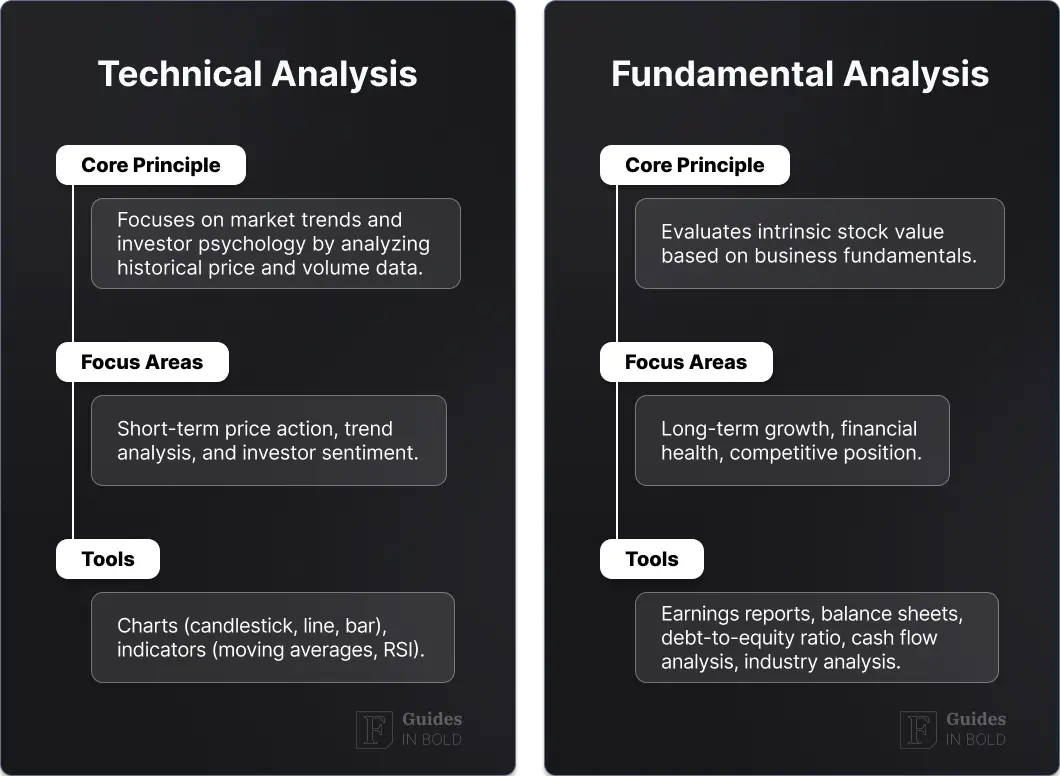
Technical analysis vs. fundamental analysis
Technical analysis aims to predict future prices by looking at past data. On the other hand, fundamental analysis determines if, for instance, a stock that is used as an example throughout is under- or overvalued by looking into the company’s fundamental factors.
In a simple explanation, fundamental analysis defines whether the stock might be trading under or over its listed value by looking at the fundamentals. In contrast, technical analysis assumes the price is already correct and attempts to forecast future price movements instead.
Investors can use both technical and fundamental analysis to identify investment opportunities to close the price gap between the stock’s fair value and its market price. However, both techniques have their supporters and opponents.
Three key assumptions of technical analysis
The technical analysis evaluates and identifies profitable investment opportunities by tracking statistical trends from past data presented on charts.
It also attempts to understand the overall market sentiment and the investors’ attitude towards a specific security or financial market reflected through asset price movements and supply and demand activity in a particular market.
Charles Dow, an American financial journalist behind the Dow Theory, formulated a basis for technical analysis. His editorials included discussions about two basic assumptions, a framework for technical analysis. Firstly, all markets are efficient, but even random price fluctuations can be identified through historical patterns and trends that tend to repeat in the future.
What is technical analysis based on?
Today’s analysis is based on Dow’s ideas and accepts three general assumptions:
- The market discounts everything
While related to the efficient market hypothesis (EMH), technical analysis assumes that price action reflects available information and market psychology, even if markets are not perfectly efficient.
However, technical analysis assumes that further investigation of past price movements can help to identify gaps between a stock’s fair value and market value and also consider the supply and demand of an asset in their evaluation.
- Prices follow a past trend
Secondly, technical analysis assumes that asset prices, even random, will form a pattern and trend no matter the time frame. That is, the price of a stock is more likely to continue in a similar trend to what occurred in the past rather than move in a random direction. Among various technical trading strategies and indicators, most are based on this second assumption.
- History tends to repeat itself
Lastly, technical analysis assumes that past events tend to repeat themselves, and price movements are often repetitive. It is associated and reasoned by market psychology, human emotions such as panic, which urges investors to sell, or overenthusiasm to make impulse investments.
Technical analysis and charting analyze these human emotions and predict future price movements. This data is then translated into patterns and trends by looking at historical transactions, prices, and volumes.
While there are various forms of technical trading analysis, using chart patterns to analyze human emotions’ effect on prices is still relevant as it illustrates specific price fluctuations.
Best Crypto Exchange for Intermediate Traders and Investors
-
Invest in cryptocurrencies and 3,000+ other assets including stocks and precious metals.
-
0% commission on stocks - buy in bulk or just a fraction from as little as $10. Other fees apply. For more information, visit etoro.com/trading/fees.
-
Copy top-performing traders in real time, automatically.
-
eToro USA is registered with FINRA for securities trading.
Charting and technical analysis
One of the most rudimentary aspects and indicators of technical analysis is identifying chart patterns using different types of charts as the source of information. The primary tools used are chart patterns and technical indicators.
Whereas charts and patterns help display historical price data and trading volumes on a graphical display, technical indicators placed on top of charts help to analyze and derive insights. While both approaches can be valid on their own, many analysts opt to combine them with their own tools, methods, and research for a cohesive trading approach to find added value.
Charts can display data about past price performance and supply and demand behavior, which is a basis for forecasting what might happen in the future. Moreover, volume is also a crucial aspect of technical analysis. It can be an indicator of buyer and seller conviction in influencing the prices.
There are several types of charts used by analysts depending on their trading goals, and the most common ones include line charts, bar charts, or candlestick charts.
Line charts
A line chart is the simplest method for displaying price data. However, it is used less often than a bar chart as it only allows for displaying a specific trading period.
It is therefore only used primarily for long-term trends, and for an in-depth analysis, other charts are necessary.

On the above chart image, the line joins together market closing prices of a chosen period, for example, weekly closings for the weekly line chat, or monthly closings for the monthly charts, etc.
Bar charts
Bar charts are the most commonly used types in technical analysis and display essential information, including the opening price and high and low price during a chosen trading period.

Each vertical line connects the highest and the lowest price of the chosen trading period. The horizontal line on the left indicates the opening price, and the horizontal line on the right shows the closing price for that period.
On most charts, if the horizontal left line is lower than a horizontal line on the right, then the bar will be shaded green, representing a growth period.
Candlestick charts
Candlestick charts are popular among traders as they display patterns, including market sentiment and the emotion of buyers and sellers. Similarly, bar charts represent all the same information and show four prices: open, high, low, and close.

The more wide vertical lines – candles – portray differences between the opening and closing price. The red candles show when the closing was below the opening price, and the green ones offer a time when the opening price was below the closing price.
Candlesticks can indicate emotions by visualizing the size of price moves with different colors. The candlesticks are used to make decisions based on occurring trends and patterns. This can help traders forecast mainly the short-term price movement directions. However, this doesn’t mean all patterns are accurate, and candlesticks represent tendencies, not guarantees, in price movements.
Point-and-figure charts
Point and figure charts focus more on the price movements of stocks rather than periods, and the lines presented on the chart present new highs and new lows.

What is a technical indicator?
On top of charts and patterns, technicians use various technical indicators – mathematical calculations that show trade entry or exit signals considering price movements and market sentiment – usually overlaid on top of charts.
These signals can help investors accurately forecast future price movements and know whether to buy, hold, or sell their assets. In addition, technical indicators are generally used to obtain additional information in combination with basic chart patterns – placed over the chart data to predict where prices might be heading.
There are many ways for technical analysts to use such indicators. For instance, some can help to assess how long a trend is expected to continue; others might focus on just identifying the current market trends.
Types of technical indicators
Thousands of indicators exist, and traders should work out the best ones for their trading style and strategy and understand what they are and how they work.
Some main types of technical indicators include trend following, oscillators, volatility, and support and resistance, which are grouped based on their function.
Trend following indicators
Identifying trends is one of the most crucial aspects of technical analysis. Trend-following indicators can help traders point out the direction of the movement, whether it is trending up or trending down, and point out if the trend is even there.
However, it isn’t always as straightforward as it sounds because prices move in many periods of highs and lows, and the overall direction can help establish a trend and know where the market is going.
An uptrend is a progression of higher highs and higher lows, and the analyst draws a line that connects these lows on the chart. Likewise, a downtrend is a sequence of lower highs and lower lows, connecting these on the price chart.
Some common trend indicators include:
- A moving average indicator (MA);
- Ichimoku Indicator;
- Average Directional Index (ADX Indicator).
Oscillator indicators
Oscillators can help indicate whether assets are overbought or oversold and show momentum progression. For example, if the price is increasing, oscillators will also move higher, and if the prices are dropping lower, oscillators will also move downward.
It is a tool that constructs high and low price bands between two extreme values and a trend indicator that fluctuates between these two bounds.
Some common oscillator indicators include:
- RSI Indicator;
- Stochastics Indicator;
- CCI Indicator;
- MACD Indicator.
Volatility indicators
To know volatile periods, traders can use volatility indicators, which help to reveal periods of high and low volatility of a particular stock’s assets or the whole market.
For example, a currency pair can have significant up- and downswings in price. If the prices fluctuate a lot, it shows high volatility, and a currency pair where prices are stable have low volatility.
Some common volatility indicators include:
- Bollinger Bands® Indicator;
- ATR Indicator.
Support and resistance indicators
Support and resistance indicators are a crucial aspect of technical analysis and refer to price levels when market prices struggle to cross a level and break through.
For example, support levels are formed if a decreasing market gets to a certain low point and then bounces back. On the other hand, resistance occurs when an increasing market hits its highest point and then falls.
When the market or an individual asset hits these points several times, a pattern is formed and becomes a more reliable trend to project how prices will act in the future, and when this trend is about to reverse – when the prices are likely to rise or fall again.
On charts, resistance lines are visualized as horizontal and start at the recent most extreme price peak, with the line pointing toward the future on the time axis. Likewise, support lines are horizontal lines that start at the recent extreme low price and point toward the future.
An uptrend continues until the most recent peak is exceeded and the price reaches the new highest extreme levels, and the downtrend continues until the price reaches its new lowest low.
Some common support and resistance indicators include:
- Pivot points;
- Fibonacci retracement;
- Donchian Channels.
Technical analysis support and resistance example

For example, the chart above shows Microsoft (NASDAQ: MSFT) in July 1997, when their stock reached a high of 19. The price then started to correct and didn’t climb above this level until February 1998, when 19 became resistance, when the previous support became resistance, and resistance became support. The same happened for the peak at 30 in July 1998, when the price rose above that resistance in November 1998.
Technical analysis time frames
It is important to define the suitable period in which data is analyzed to apply different technical analysis techniques and identify patterns. Charting and technical indicators become more reliable when the time scale extends to longer periods.
Technical analysis time frames specified on charts can range from:
- 5-minute charts;
- 15-minute charts;
- Hourly charts;
- 4-hourly charts;
- Daily charts;
- Weekly charts;
- Monthly charts;
- YTD (Year-to-Date) charts.
Time frames viewed on charts depend on the outcome and each investor’s trading needs. For example, investors using fundamental analysis might use charts on a weekly or monthly scale, as more extended periods allow for more consolidation and trend periods. On the other hand, long-term traders who hold positions overnight or for a few days may opt to use 4-hour daily or weekly charts.
However, intra-day traders who open and close positions on the same day benefit more from analyzing shorter, 5-minute, 15-minute, or hourly charts, as price movements that occur over a briefer time are significant for short-term than long-term traders.
It’s best to start with reading weekly or monthly charts, as long-term patterns give a good overview and perspective, as short-term views can often be misleading. Once the experience is there, it’s easier to investigate and read intraday charts.
Technical analysis patterns
In technical analysis, chart patterns appear on price charts when they create a recognizable shape. You can identify price patterns through various trend lines and curves to make trends more apparent and recognizable.
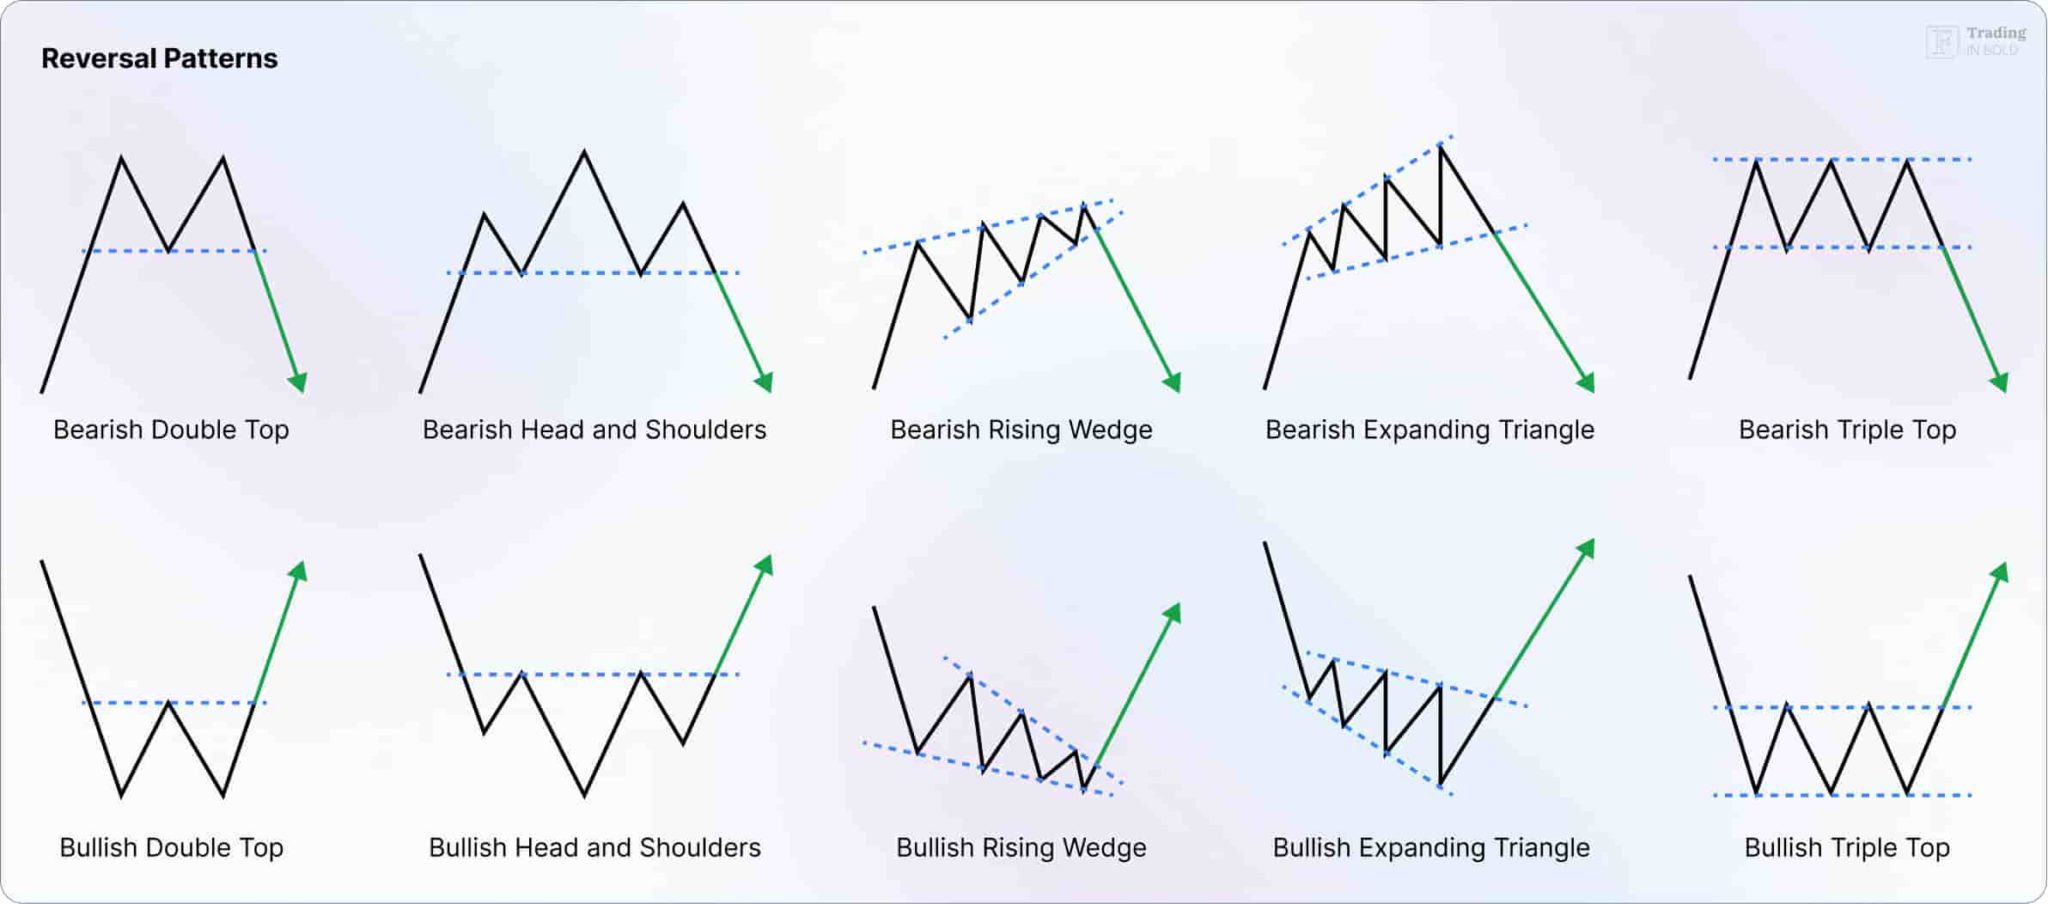
There are two different main chart patterns: a reversal pattern is when a price change occurs, and a continuation pattern is if the trend continues in an existing direction:
Reversal patterns:
- Head and shoulders (H&S);
- Inverse head and shoulders (H&S);
- Death cross*;
- Golden cross*;
- Double top pattern;
- Double bottom pattern;
- Triple top pattern;
- Triple bottom pattern.
*Golden cross and death cross are often interpreted as longer-term trend confirmations rather than immediate price reversals.
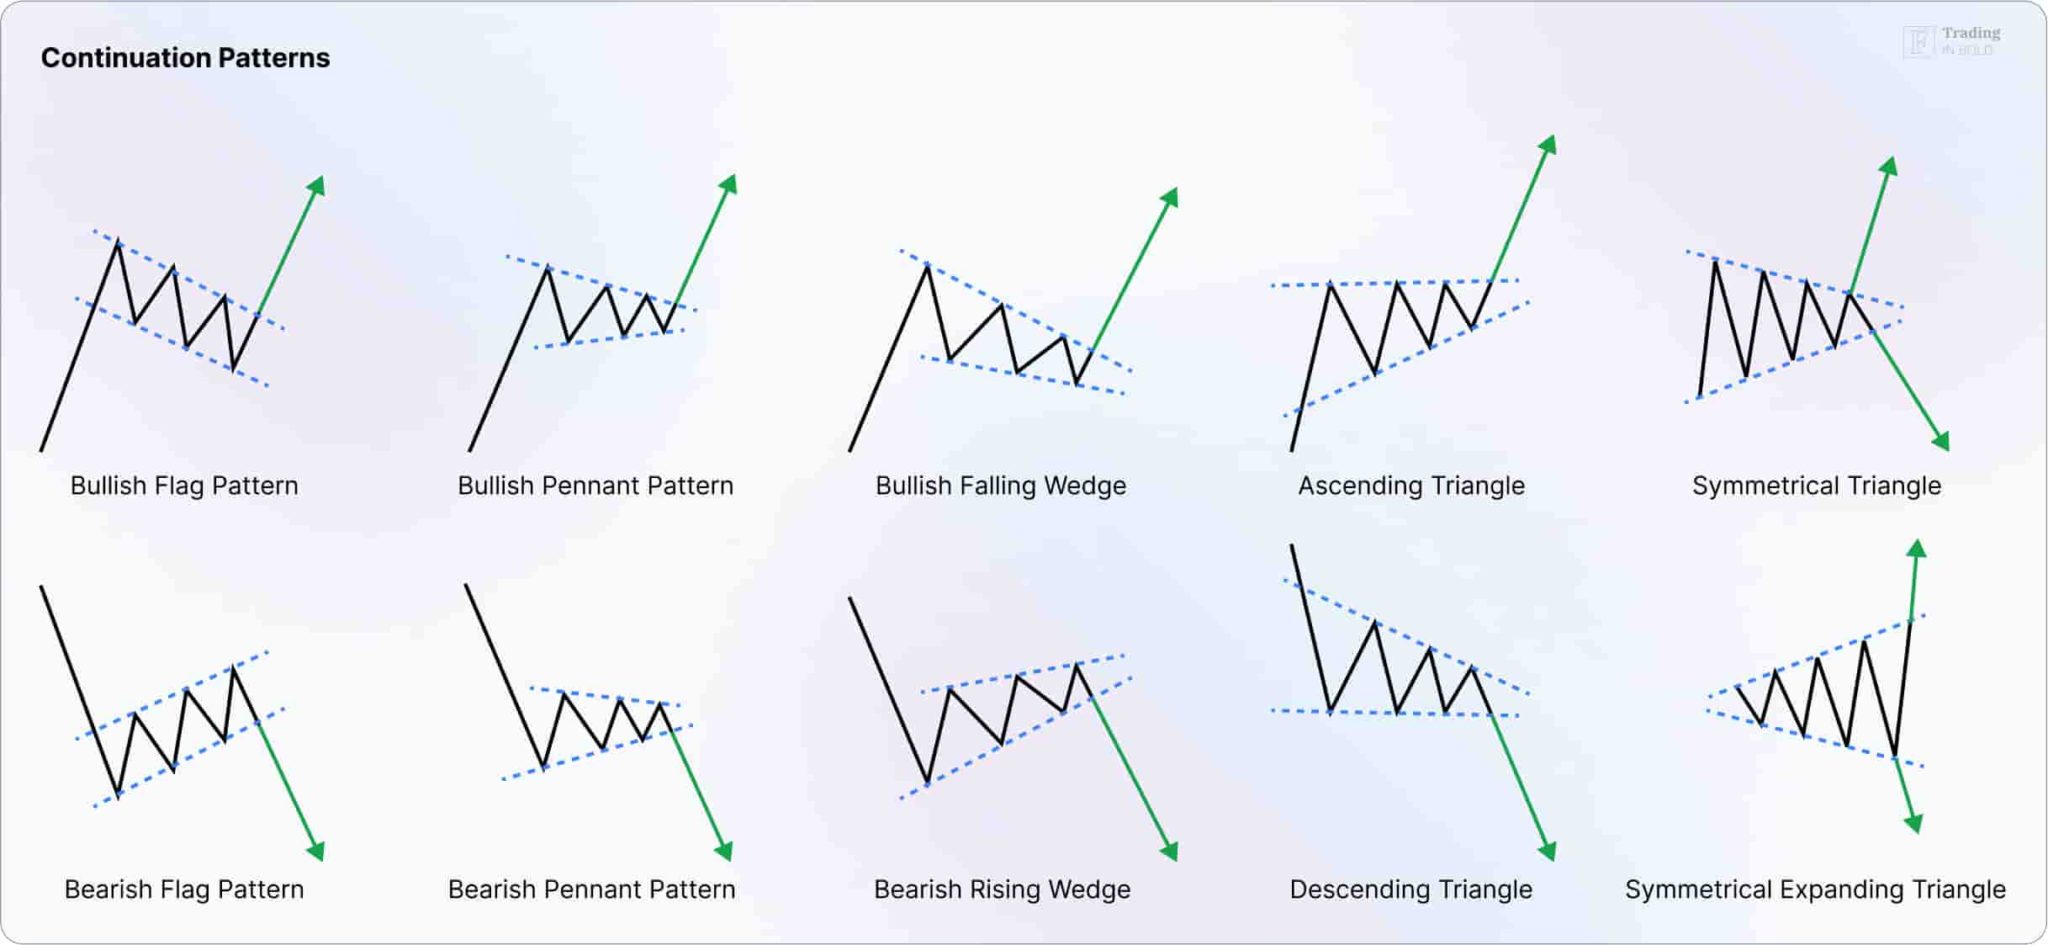
Continuation patterns:
- Triangles (symmetrical, ascending, and descending);
- Rectangles (bullish and bearish);
- Flags;
- Pennants.
How to learn technical analysis?
Even though technical analysis may seem intimidating at first, there are various ways to learn it. The first step would be to start with the basics. That is, read about investing, how the markets, stocks, and the economy, and gain a thorough understanding of the core concepts.
Moreover, there is also a lot of education material online that is free of charge if you are tight on budget. Still, one of the best and fastest ways to learn is to seek out professional traders who could teach you personally one-on-one.
After that, take what you learned and test them with backtesting – simulated trading that allows you to trade without using real money.
In practice, many traders now rely on paper-trading platforms and market simulators that mirror live market conditions without risking capital. These tools allow users to test technical strategies across different assets, timeframes, and volatility environments before applying them in real markets.
Modern charting platforms also offer automated pattern recognition, custom indicators, and AI-assisted analysis. While these tools can improve efficiency and idea generation, most experienced traders still treat them as supportive tools rather than replacements for human judgment and risk management.
The next step is to define your techniques depending on your goals. Different traders use their forms of analysis. For example, day traders might use trendlines, whereas swing traders prioritize chart patterns or technical trading indicators.
Key considerations to learning technical analysis:
- Get an understanding of the aim of technical analysis;
- Seek out educators who can teach you;
- Backtest trading strategies to see how they could have performed;
- Practicing trading and evaluating features in a demo trading tool account;
- Keep in mind that technical analysis isn’t always 100% accurate;
- Don’t go all in right away – start small to gain experience.
Technical analysis strategy approaches
There are two ways to approach technical analysis: the top-down (common for short-term traders) and the bottom-up (common for long-term investors).
- Top-Down
Top-down traders or day traders look at the overall economy rather than focusing on individual stocks. At first, they would approach their analysis by looking at the economy, sectors, and then stocks of companies. It’s mainly for short-term views, for example, daily trade opportunities, rather than monthly.
- Bottom-Up
Bottom-up traders, on the other hand, focus on individual stocks instead of the overall economy, which includes analyzing a stock that appears attractive for low or high price points. For example, if an investor finds an undervalued stock, technical analysis can help to define when the price could reach its lowest lows for an entry point.
Technical analysis pros and cons

Pros
- Can be understood with some training, reading, and research.
- Data needed for technical analysis is usually easily available.
- Gives a idea of entry and exit prices required to optimize trades.

Cons
- No recommended for beginners, requires learning and understanding to implement profitably.
- Less commonly used as a standalone tool for long-term investing, but often combined with fundamental analysis.
- Experience improves accuracy, but beginners can apply basic concepts with proper risk management.
In conclusion
Overall, even though technical analysis can be a helpful trading tool, it is crucial to remember it isn’t perfect and completely accurate. So always keep warning signals in mind, as some patterns, trends, or technical trading indicators can be misleading. However, if done well, this technique can undoubtedly enhance your chances for successful trades and improve profitability.
Disclaimer: The content on this site should not be considered investment advice. Investing is speculative. When investing, your capital is at risk.
FAQs on technical analysis
What is technical analysis?
Technical analysis is a trading technique that investors use to discover new investment opportunities. For example, to predict future price movements of stocks or other assets, you must analyze past price and volume data presented on price charts, where one can identify trends, patterns, and technical indicators.
How to learn technical analysis?
If you want to learn technical analysis, find a good online course and spend time reading free available online sources. Next, if you’re going to learn fast, seek assistance from a professional trader. They can teach you everything in-depth in one-on-one sessions or practice backtesting for a more cost-effective option.
What are technical analysis patterns?
In technical analysis, specific patterns appear in the data, creating recognizable shares and drawing various trendlines, shapes, and curves. Two main chart pattern types are reversal patterns, which occur when prices change, and continuation patterns, when a trend continues in the same direction.
What is a technical indicator?
A technical indicator is a mathematical calculation that shows trade entry and exit signals by considering price movements and market sentiment and helps investors forecast future prices and make better trading decisions. The main types of technical indicators include trend following, oscillators, volatility, support, resistance, or moving averages.
What's the Difference Between Fundamental and Technical Analysis?
Fundamental analysis serves to evaluate the true value of a stock by examining the company’s financials. In contrast, technical analysis relies on stock charts to spot historical patterns and trends, providing insights into future price movements.
Why does technical analysis work?
Technical analysis works because it uses historical price data and trading volumes to identify patterns and trends in financial markets. These patterns can help predict future price movements based on the assumption that market behavior repeats over time. Technical analysis relies on the psychological factors influencing traders and the collective actions reflected in the price charts.