
Bitcoin (BTC) price faces five more months of extreme pain as per on-chain data analyzed by Finbold on March 12.
Bitcoin’s realized profit-to-loss ratio, for the 90-day Simple Moving Average (SMA), has signaled the final leg of the 2026 bear market, according to data from Glassnode, an on-chain analytics platform. Since February 21, this indicator has been trading below the neutral level of 1.
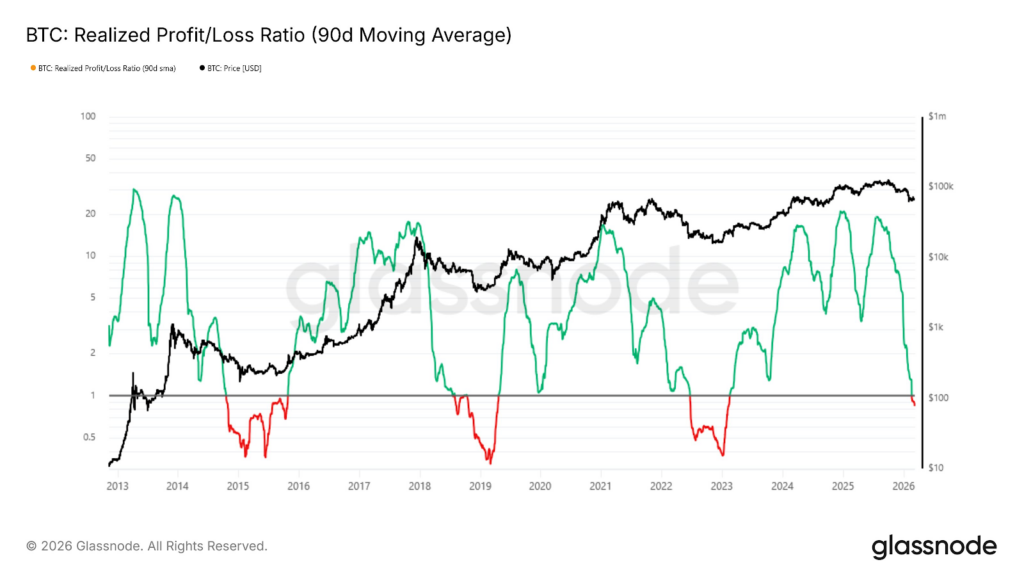
Historically, if Bitcoin’s realized profit-to-loss ratio dropped below 1, it took six months before reclaiming above the neutral level. As such, BTC’s price could experience five more months of bleeding, if history repeats itself.
Bitcoin price faces a 2022 style midterm
As per the Market Value to Realized Value (MVRV) indicator, a metric used to determine whether an asset is overvalued or undervalued relative to the price at which coins last moved on-chain, Bitcoin’s long-term returns are about the same level observed in the final week of 2022.
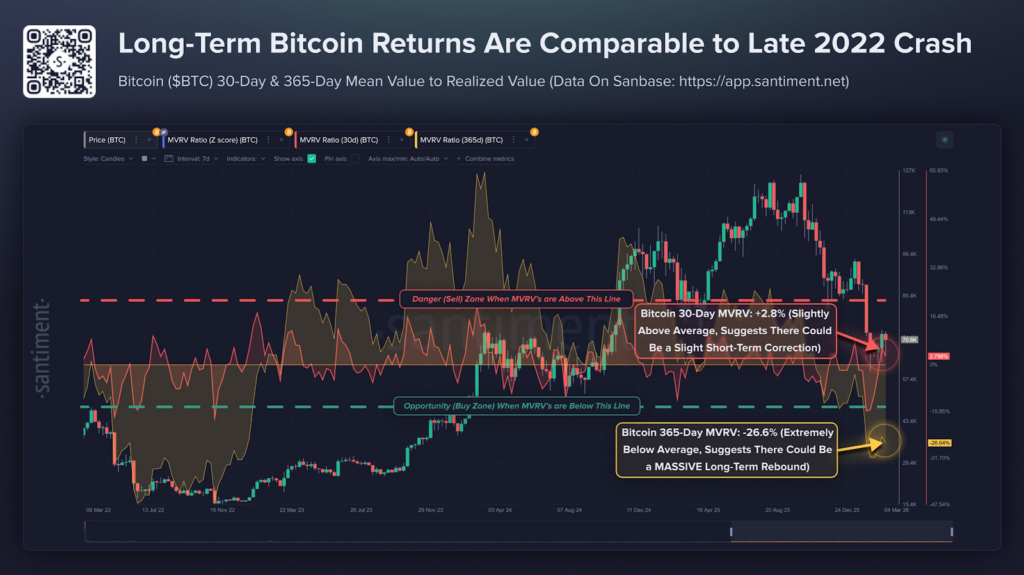
Although the circumstances have changed in the span of three years, Santiment, an on-chain analytics platform, highlighted that the MVRV tends to follow the same trend.

“When the 365-day MVRV was severely negative following the FTX collapse, BTC proceeded to rise +67% in the following 3 months. This is typical when average returns are significantly below the average value for what is historically expected,” Santiment noted.
What’s the midterm expectation for BTC price?
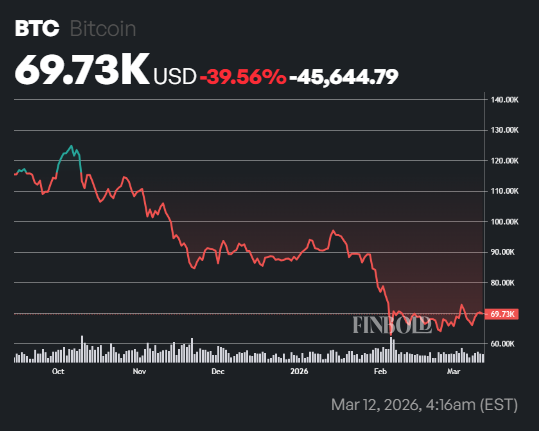
Bitcoin’s price has been trapped in a multi-month bearish trend to trade about $69,730 at press time.
During the past five weeks, BTC’s price has been consolidating between $71,000 and $65,000 in preparation for its final leg down, according to an analysis by Benjamin Cowen, CEO and founder of Into The Cryptoverse.
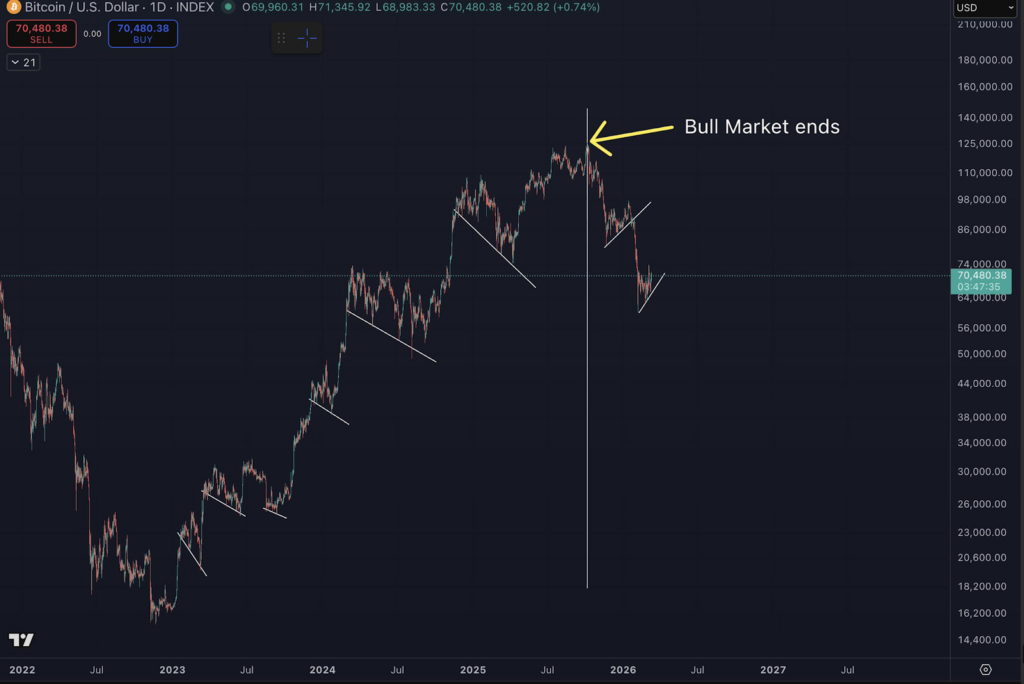
However, if BTC price reclaims $94,000 as a support level, the midterm bearish sentiment will be invalidated.