After reaching the $17,000 level, pushing up most of the cryptocurrency market with it, a pattern has emerged with Bitcoin (BTC) moving in a similar way to that from over two years ago, which eventually led to a bullish rally for BTC.
Specifically, Bitcoin has been mimicking indicators from 2020, including a down-slope neckline, lows price action, relative strength index (RSI) up-slope neckline, and RSI moving average (MA) uptrend, as observed by prominent crypto trading analyst Trader Tardigrade on November 30.
As the analyst noted, this price action in early 2020 resulted in a breakout for the flagship decentralized finance (DeFi) token, peaking at around $10,500, which means that a similar result could be expected in December 2022, potentially closing the year in the area at around $19,700.
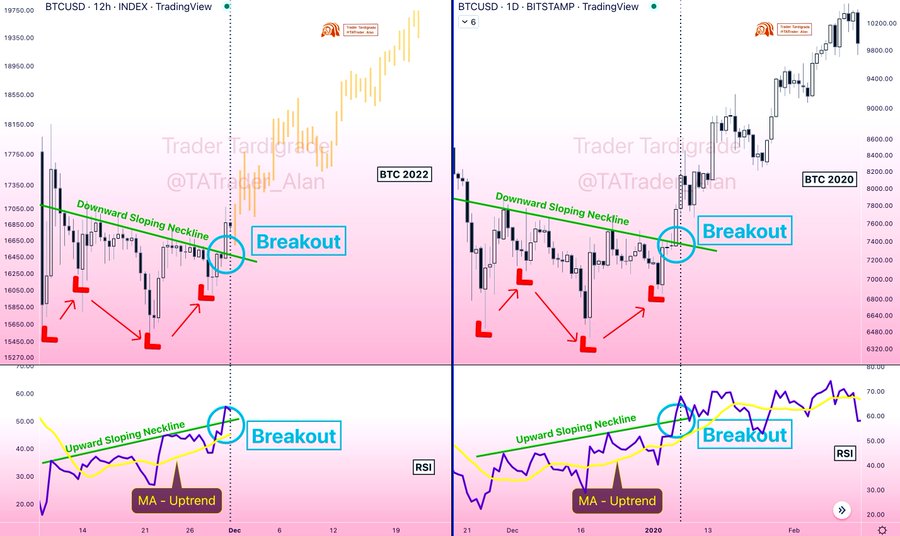
Meanwhile, Trader Targidrade’s analysis was confirmed by a fellow crypto analyst known as Mags, who posted on December 1 another side-by-side chart to illustrate the similarities between Bitcoin’s price activities in 2020 and 2022.
More indicators of upcoming rally
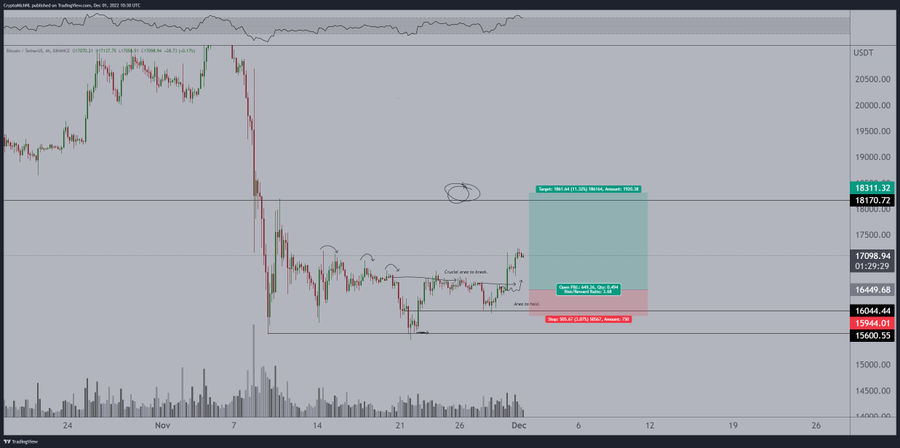
At the same time, crypto trading expert Michaël van de Poppe highlighted that “as long as Bitcoin remains above $16.6-16.8K, the thesis still stands on this long,” posting his analysis of the Bitcoin price action on December 1.
Furthermore, pseudonymous crypto analyst Moustache revealed that “every time BTC has dropped in the last 8 months, there has always been a relief rally back to the 0.5 FIB line,” setting the 0.5 Fib target at around $18,500.
On top of that, Trader Tardigrade has also published an analysis of historical ‘Bitcoin halving rallies’ that typically started “at 14-18 months before the halving month,” the next of which is estimated to be March 2024.
Bitcoin price analysis
At press time, Bitcoin has dropped below the previously reached $17,000 line, and was changing hands at $16,987, recording a modest increase of 0.90% on the day and 2.70% across the previous seven days, still trying to recover from the loss of 16.88% on its monthly chart.
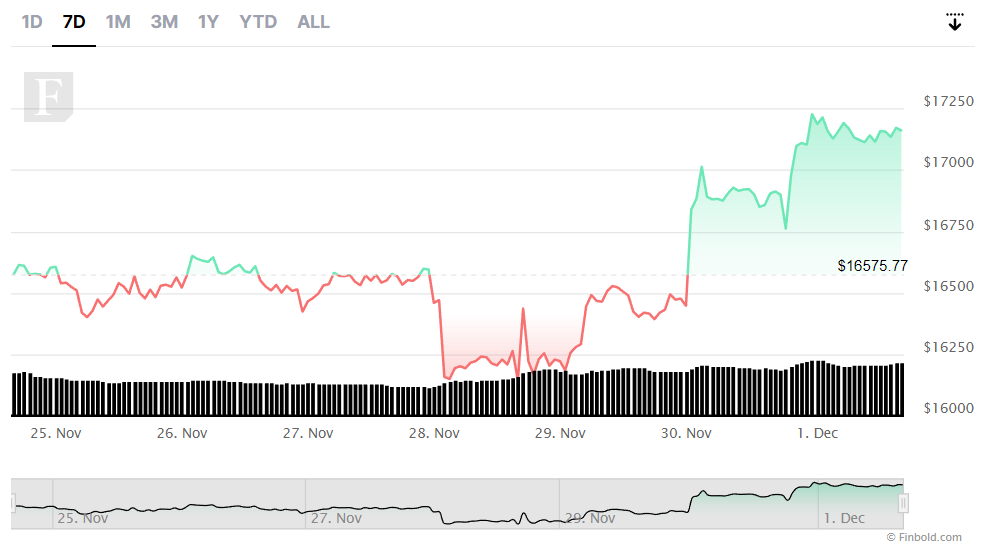
As things stand, Bitcoin’s market capitalization presently amounts to $326.21 billion, retaining its position as the largest cryptocurrency by this indicator, as per CoinMarketCap data retrieved by Finbold on December 1.
Disclaimer: The content on this site should not be considered investment advice. Investing is speculative. When investing, your capital is at risk.