The following guide will examine the relative strength index (RSI), what it is and what it measures, how to understand the indicator on charts and interpret those findings, as well as the pros and cons of using this technical analysis tool.
Best Crypto Exchange for Intermediate Traders and Investors
-
Invest in cryptocurrencies and 3,000+ other assets including stocks and precious metals.
-
0% commission on stocks - buy in bulk or just a fraction from as little as $10. Other fees apply. For more information, visit etoro.com/trading/fees.
-
Copy top-performing traders in real time, automatically.
-
eToro USA is registered with FINRA for securities trading.
What is the RSI indicator?
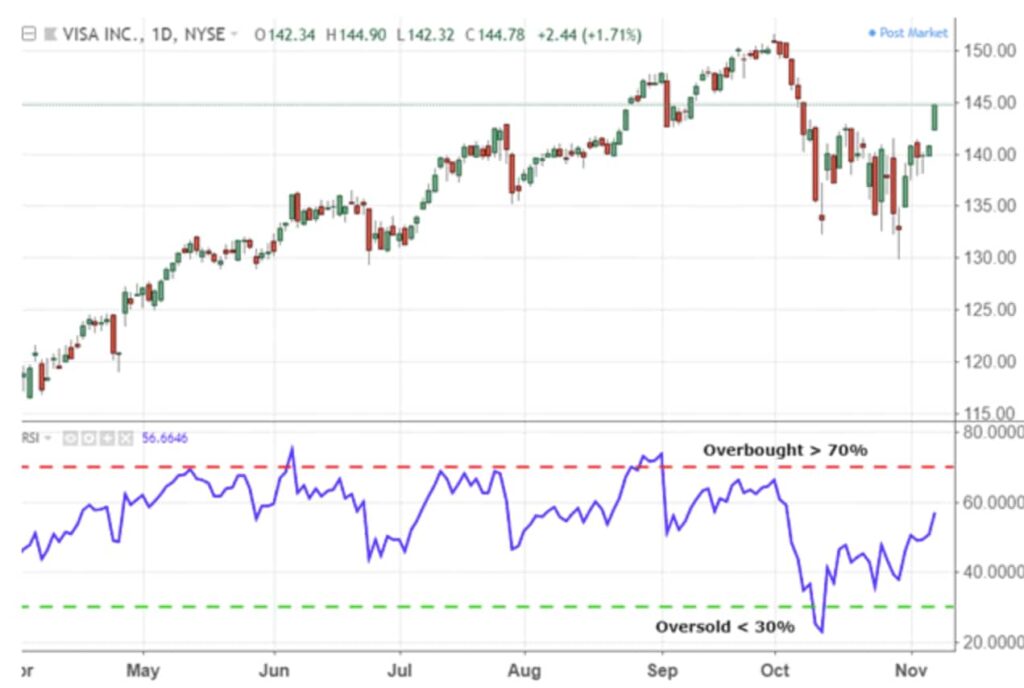
The RSI is displayed as an oscillator, i.e., a line graph on a scale of zero to 100. It was developed by J. Welles Wilder Jr. and explained in detail in his 1978 book, “New Concepts in Technical Trading Systems.”
The momentum oscillator can demonstrate overbought and oversold conditions, as well as point to a general trend or securities that may be primed for a trend reversal or corrective pullbacks in price. Traders typically interpret the RSI line moving below the overbought line or above the oversold line as a signal to buy or sell.
Beginners’ corner:
- What is Investing? Putting Money to Work
- 17 Common Investing Mistakes to Avoid
- 15 Top-Rated Investment Books of All Time
- How to Buy Stocks? Complete Beginner’s Guide
- 10 Best Stock Trading Books for Beginners
- 15 Highest-Rated Crypto Books for Beginners
- 6 Basic Rules of Investing
- Dividend Investing for Beginners
- Top 6 Real Estate Investing Books for Beginners
- 5 Passive Income Investment Ideas
How does the RSI indicator work?
The RSI is calculated over a set number of periods, typically 14. It’s important to note that these periods could be days, weeks, or even minutes, depending on the data being analyzed. Adjusting the number of periods can modify the RSI’s sensitivity: a shorter period, like 10, increases sensitivity, making the indicator more likely to show overbought or oversold conditions than a longer period like 20, which reduces sensitivity.
Generally, an RSI reading of 70 or above indicates overbought conditions. Conversely, a reading of 30 or below points to an oversold situation. However, these traditional levels can be altered to fit the particular security better. For instance, if the security is repeatedly reaching the overbought level of 70, you may want to alter this level to 80.
Knowing the asset’s primary trend is crucial for understanding RSI readings correctly. For example, as proposed by Constance Brown in “Technical Analysis for the Trading Professional,” an oversold reading in an uptrend is possibly much higher than 30. Similarly, an overbought reading during a downtrend is much lower than 70.
Many investors create a horizontal trendline (a line drawn over the highs and under the lows to create a channel) between 30 and 70 when a strong trend is in place to identify the overall trend and extremes better.
However, modifying overbought or oversold RSI levels when the price of a security is in a long-term horizontal channel instead of a solid upward or downward trend is usually unnecessary.
The RSI is not as reliable in trending markets as in trading ranges. In fact, most traders accept that the signals given by the RSI in strong upward or downward trends often can be false.
Recommended video: Beginners guide to the RSI indicator
The RSI indicator formula
The RSI uses a two-part calculation. First, it is required to calculate the relative strength (RS), which equals the average gain divided by the average loss:
RS = Average Gain / Average Loss
Then, once there are 14 (the standard number of periods recommended by Wilder) periods of data available, the second calculation can be made. The formula is as follows:
RSI = 100 – (100 / (1+RS))
Example RSI calculation
For example, during a 14-day trading period, let’s assume that stock ABC has generated positive returns on nine days with an average gain of 2% and negative returns on five days with an average loss of 1%. Then, plugging those figures into the two formulas, we get:
RS = 0.02 / .01 = 2
RSI = 100 – 100 / (1 + 2) = 66.67
How to use the RSI indicator?
Traders can use the RSI indicator to:
- Predict the price behavior of an asset;
- Validate trends and trend reversals;
- Point to overbought and oversold securities;
- Identify buy and sell signals;
- Develop a trading strategy in conjunction with other technical analysis tools.
RSI indicator buy and sell signals
RSI buy and sell signals can be determined by:
- Identifying overbought and oversold conditions;
- RSI divergence indicator;
- Positive and negative RSI reversals;
- Swing rejections;
- Interpreting RSI ranges.
1. Identifying overbought and oversold conditions
Typically, an RSI less than 30 is considered a bullish sign, while RSI above 70 is regarded as a bearish sign. Additionally, when the RSI indicator crosses 70 on the RSI chart, it indicates that an asset is becoming overbought or overvalued, i.e., it may be primed for a trend reversal or corrective price pullback. Conversely, an RSI of 30 or below suggests an oversold or undervalued condition.
Overbought describes a period with a significant and consistent upward movement in price over time without much pullback. It is a term used when an asset is believed to trade at a price beyond its intrinsic value, meaning it’s priced above where it should be according to technical and fundamental indicators. Overbought conditions may indicate a price correction or trend reversal and signal traders to exit (sell) a position.
On the other hand, oversold defines a period with a substantial and consistent downward move in price over time without much pullback. The term refers to a condition where a security has traded well below its typical value metrics and has the potential for a price bounce. Similarly, oversold conditions may indicate a price correction or trend reversal and signal traders to enter (buy) a position.
For example, suppose a trader witnesses the RSI breaking above 70, indicating overbought conditions. In that case, they shouldn’t immediately sell their positions because they don’t know how far the price could rally. Instead, they should wait until the RSI falls back below 70 and then place their sell trade. This provides the trader with a better entry and a higher probability trade.
The same rules apply in oversold conditions. Traders should wait until the RSI crosses back above 30 before they place a buy trade.
2. RSI divergence indicator
Divergences occur when the price moves in the opposite direction of the RSI, i.e., a chart might indicate a change in momentum before a corresponding price change.
A bullish divergence occurs when:
- The price chart displays prices falling to lower lows, signified by a downward-sloping line connecting the lows;
- The RSI chart displays an oversold reading followed by lows moving higher, signified by an upward-sloping line connecting the lows.
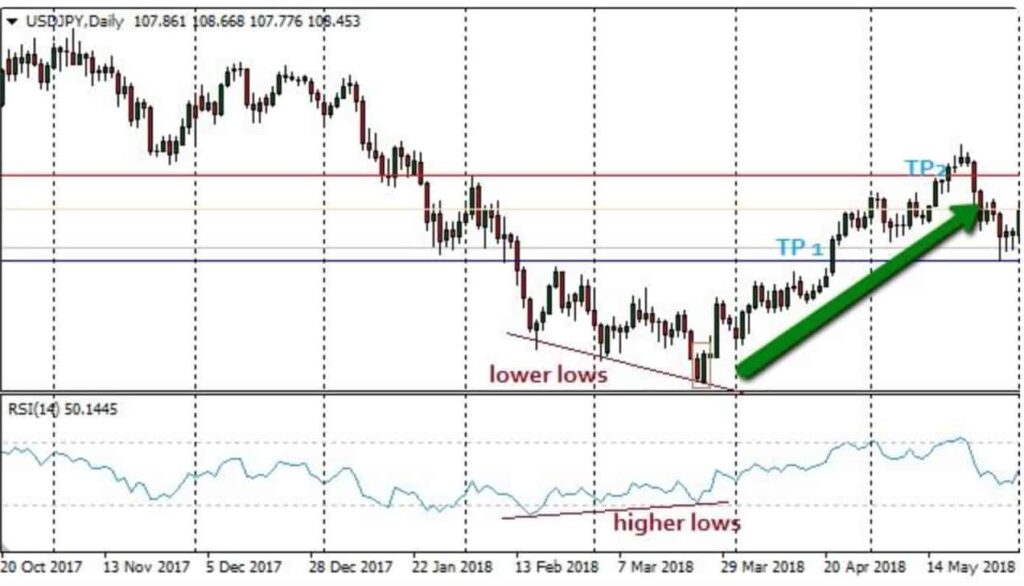
Together, these two conditions indicate rising bullish momentum, and a break above oversold territory could be used to trigger a new long position.
A bearish divergence occurs when:
- The price chart displays highs moving higher, signified by an upward-sloping line connecting the highs;
- The RSI chart displays an overbought reading followed by highs moving lower, signified by a downward sloping line connecting the highs.
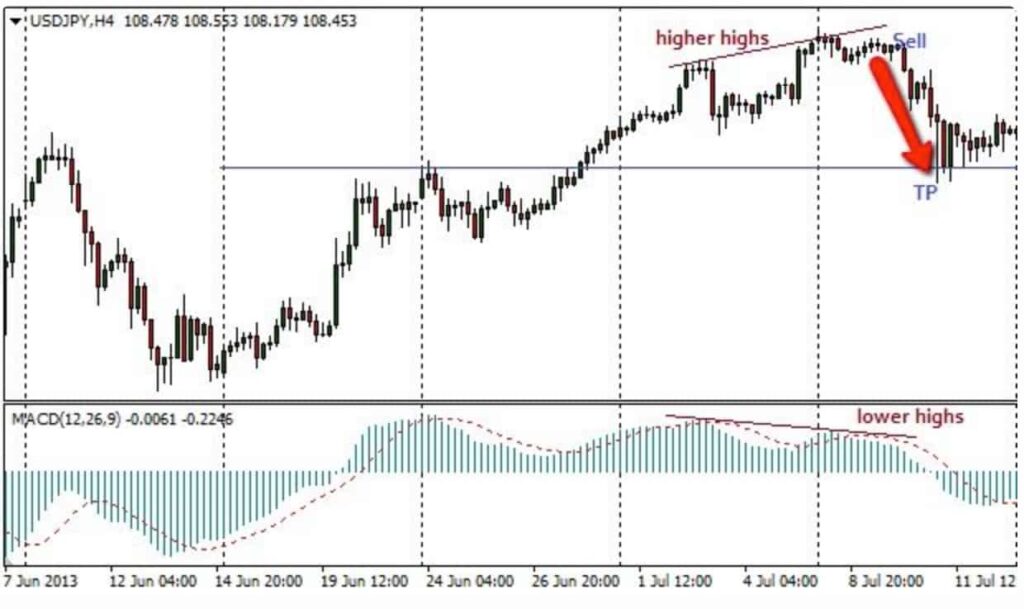
Together, these two conditions indicate rising bearish momentum.
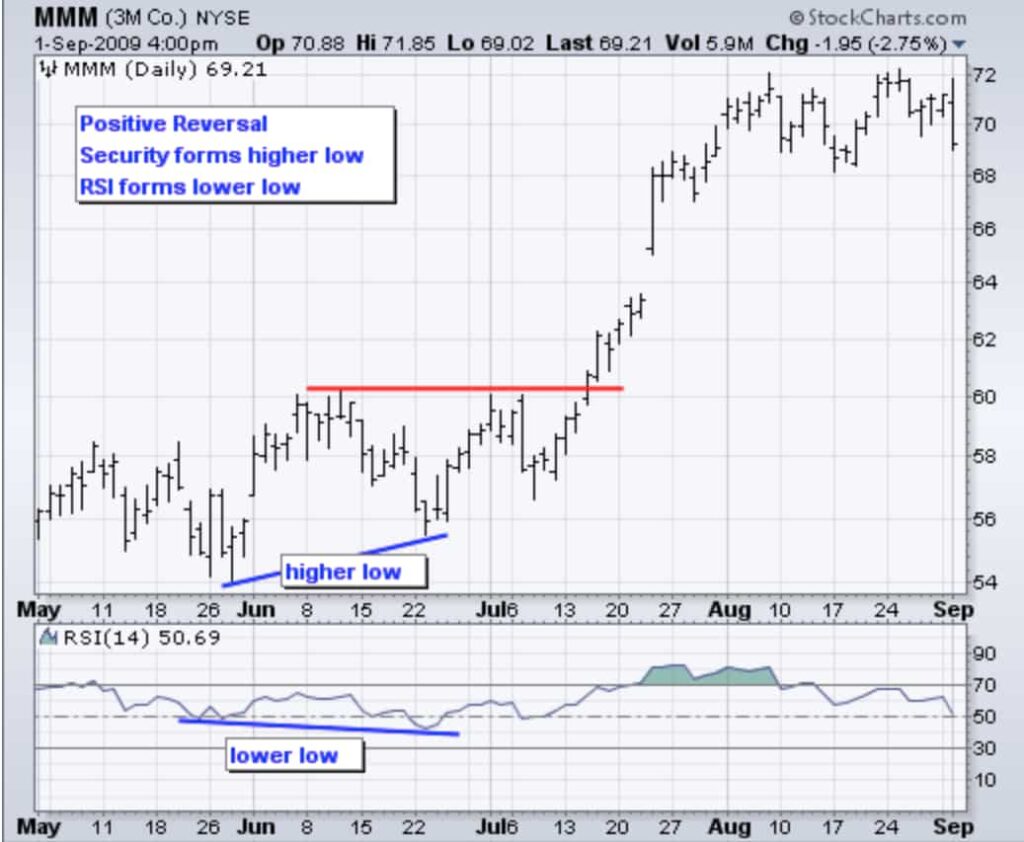
3. Positive and negative RSI reversals
Another price-RSI relationship that traders look for is positive and negative RSI reversals. Positive and negative reversals are the opposite of bearish and bullish divergences.
For example, a positive RSI reversal may occur if the RSI reaches a low that is lower than its previous low, simultaneously with the asset’s price reaching a low that is higher than its previous low price. Such a formation is viewed as a bullish sign and, thus, a buy signal for traders.
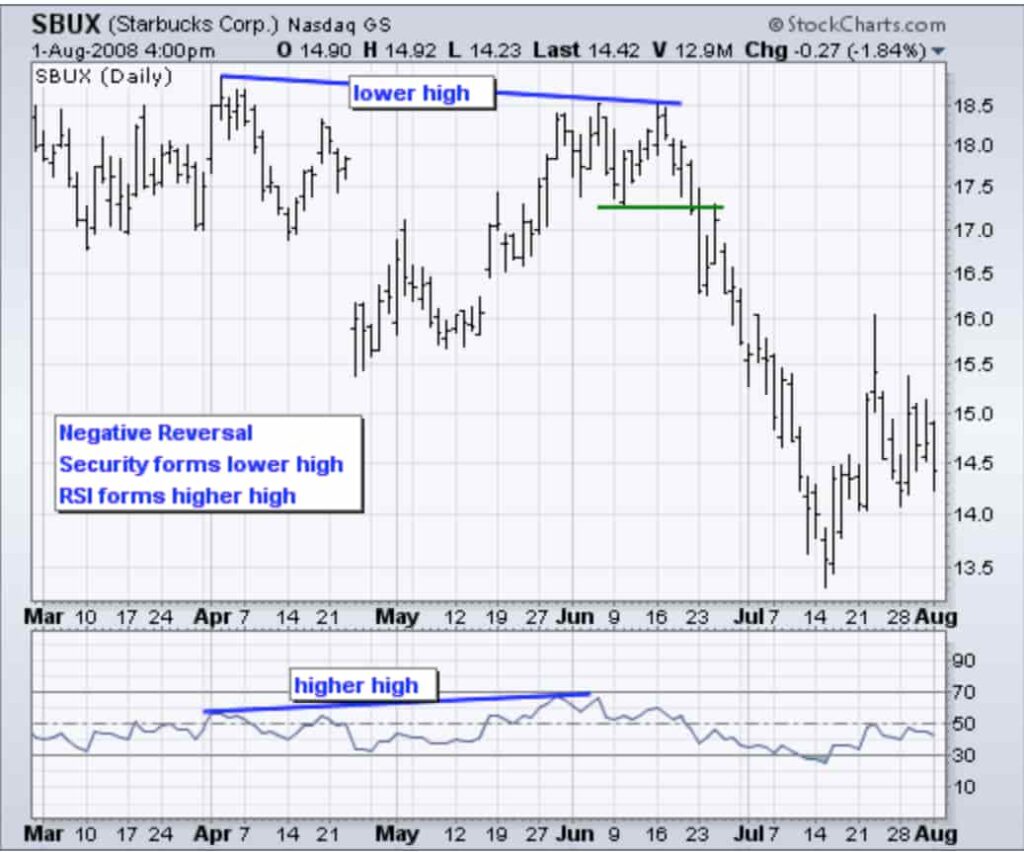
Negative RSI reversal, on the other hand, may occur once the RSI reaches a high that is higher than its previous high at the same time that the asset’s price reaches a lower high. Such a formation is considered a bearish sign and, therefore, a sell signal for traders.
4. Swing rejections
Unlike RSI divergences and positive-negative reversals, swing rejections or failure swings are independent of price action, focusing solely on RSI for signals.
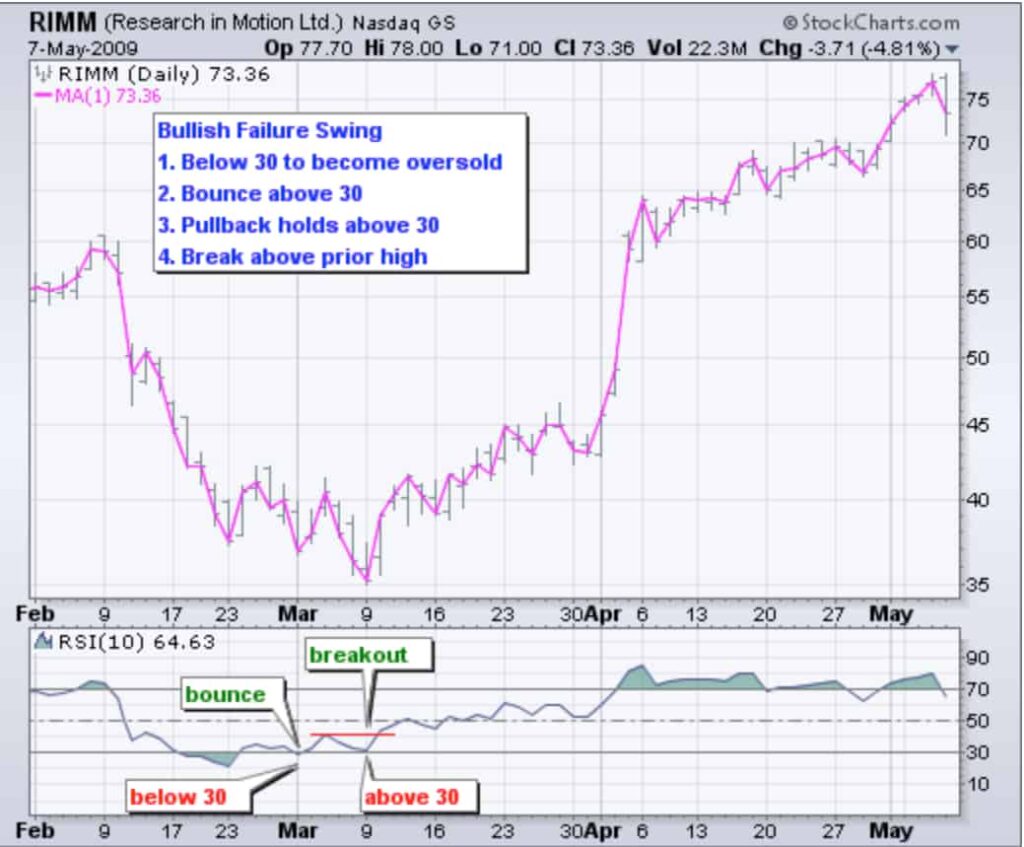
A bullish failure swing forms when:
- The RSI drops into oversold territory (below 30);
- The RSI bounces back above 30;
- The RSI establishes another dip without moving back into oversold territory;
- The RSI then breaks its prior high.
Using the RSI in this particular way is very similar to drawing trend lines on a price chart.
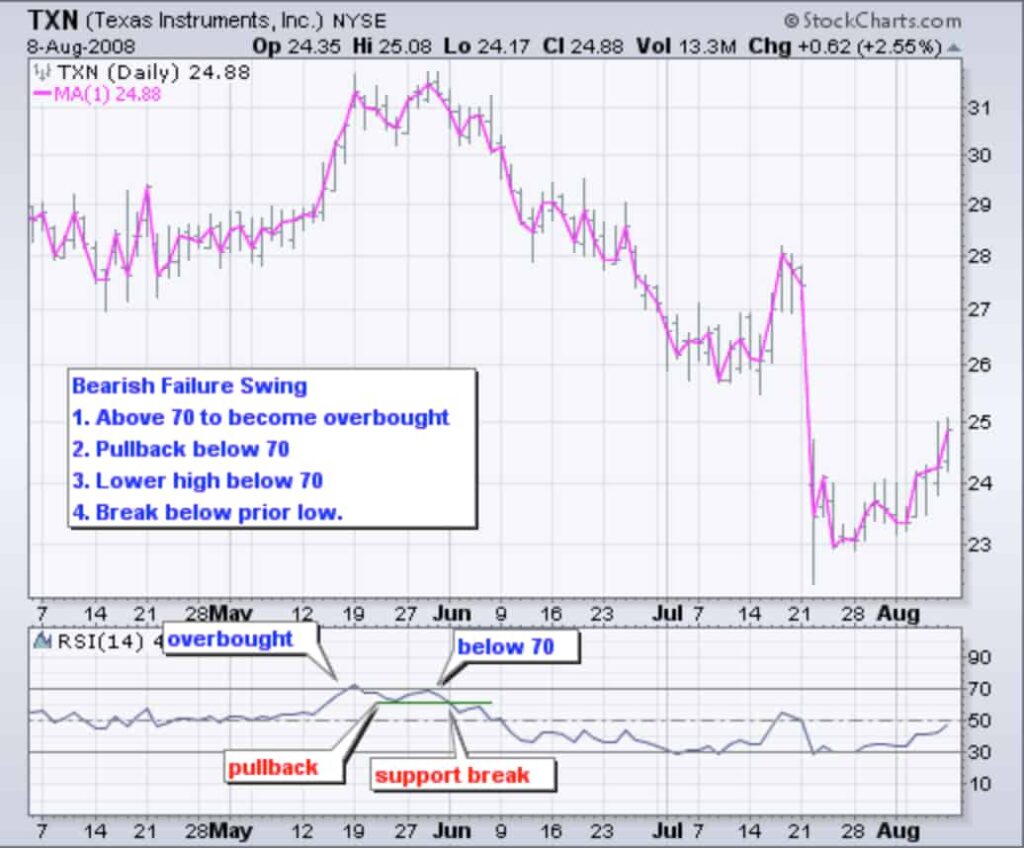
The bearish failure swing forms when:
- The RSI climbs into overbought territory (above 70);
- The RSI drops back below 70;
- The RSI establishes another high without moving back into overbought territory;
- The RSI then breaks its prior low.
As with most trading strategies, this signal will be most reliable when it follows the long-term trend. In addition, bearish signals during downward trends are less likely to provoke false alarms.
5. Interpreting RSI indicator ranges
RSI readings may fall into a range during trends. For example, during an uptrend, the RSI is likely to stay above 30 and should frequently hit 70. On the other hand, during a downtrend, it is rare to see the RSI exceed 70; instead, the indicator frequently hits 30 or below.
These guidelines can help traders determine trend strength and spot potential reversals. For example, if the RSI can’t reach 70 on several consecutive price swings during an uptrend but then drops below 30, the trend has weakened and could be reversing lower.
Conversely, if the downtrend cannot reach 30 or below and then rallies above 70, that downtrend has weakened and could be reversing to the upside. Remember, both trend lines and moving averages are helpful technical tools to include when using the RSI in this way.
Best Crypto Exchange for Intermediate Traders and Investors
-
Invest in cryptocurrencies and 3,000+ other assets including stocks and precious metals.
-
0% commission on stocks - buy in bulk or just a fraction from as little as $10. Other fees apply. For more information, visit etoro.com/trading/fees.
-
Copy top-performing traders in real time, automatically.
-
eToro USA is registered with FINRA for securities trading.
Pros and cons of RSI indicator
Like with most other technical indicators, the relative strength index, too, comes with its own set of unique benefits and limitations. Therefore, it’s crucial to understand where this particular momentum indicator triumphs and where it fails to get the most out of its use.

Pros
- Applicable to any market and timeframe;
- Helps to detect potential entry (buy) and exit (sell) points;
- Gives an overview of general price movement, trends, and trend reversals;
- Straightforward setup;
- Relatively easy to evaluate and gain needed information;
- Helpful as a stand-alone tool or in combination with other technical indicators.

Cons
- Applicable to any market and timeframe;
- Helps to detect potential entry (buy) and exit (sell) points;
- Gives an overview of general price movement, trends, and trend reversals;
- Straightforward setup;
- Relatively easy to evaluate and gain needed information;
- Helpful as a stand-alone tool or in combination with other technical indicators.
In conclusion
To sum up, the RSI measures the speed of an asset’s price changes and is used in technical analysis as a momentum indicator. As a result, it can be a powerful tool for determining trend reversals. However, because the RSI works best in oscillating markets rather than trending markets, it cannot tell investors exactly when those reversals will take place and what those price changes will be.
Additionally, the RSI is likely to generate false signals and should thus be used in conjunction with additional technical analysis tools rather than as a standalone source of trading signals.
Disclaimer: The content on this site should not be considered investment advice. Investing is speculative. When investing, your capital is at risk.
FAQs about the RSI indicator
What is the RSI indicator?
The RSI indicator is a momentum indicator used in technical analysis that measures the speed of an asset’s price changes. It provides traders with signals about bullish and bearish price momentum and is typically plotted under the security’s price graph.
How does the RSI indicator provide buy and sell signals?
The RSI indicator buy and sell signals are typically determined by specific threshold levels. A security is considered overbought when the RSI reading is above 70 and oversold when it is below 30. Traders generally interpret the RSI line moving below the overbought line or above the oversold line as a signal to buy or sell.
How can I interpret the RSI chart?
An RSI chart plots the Relative Strength Index values over time, ranging from 0 to 100. Traders look for potential overbought or oversold conditions, as well as bullish or bearish divergences between the RSI and the price chart. Overbought is typically above the 70 level, and oversold is below the 30 level on the RSI chart.
What are the RSI limitations?
Like most technical indicators, its signals are most reliable when they conform to the long-term trend. Unfortunately, accurate reversal signals are rare and can be challenging to separate from false alarms. Additionally, since the RSI is measuring momentum, it can remain in the overbought or oversold territory despite trend reversals already taking shape. Therefore, it is most trustworthy in an oscillating market when the price alternates between bullish and bearish periods rather than in trending markets.
Is there an RSI indicator app for mobile trading?
Yes, many trading platforms and apps offer the RSI as a built-in tool.
Is the RSI indicator available on TradingView?
Yes, the RSI indicator TradingView offers is among the platform’s suite of tools. You can add it to any chart, customize its settings, and even combine it with other indicators and scripts for a comprehensive technical analysis.
How to use RSI indicator?
The RSI is a momentum oscillator that measures the speed and change of price movements. Use it by watching levels above 70 (overbought) and below 30 (oversold) for trading signals. Look for divergences with price for potential reversals and consider centerline crossovers (50) as bullish or bearish signals. The RSI’s effectiveness can be enhanced when combined with other technical tools and adjusting its standard 14-period setting based on your strategy.
Is RSI a lagging indicator?
The RSI is generally viewed as a leading indicator, designed to anticipate future trends by measuring the speed and change of price movements. However, since it relies on historical data, it can sometimes lag, especially in rapidly changing markets. While it’s primarily used to predict price movements, its effectiveness can be affected by market speed and volatility.
What is the difference between stochastic indicator vs RSI?
The stochastic indicator and RSI are both momentum oscillators, but they differ in sensitivity and calculation. Stochastic, more sensitive to immediate price changes, often produces more frequent signals, making it useful in volatile, sideways markets. RSI, smoother and less prone to fluctuations, provides fewer but potentially more reliable signals, making it better for identifying and confirming longer-term trends.
What are the best RSI indicator settings?
The best RSI settings depend on your trading strategy and market conditions. The common 14-period setting provides a balanced view of price movements, making it versatile for different styles. You can adjust the period for more sensitivity or smoother data as needed. To enhance reliability, it’s important to combine RSI with other indicators.
What does RSI 14 mean?
RSI 14 refers to the Relative Strength Index calculated over a 14-period timeframe, which is the standard setting. It measures the momentum of price movements by comparing the magnitude of recent gains to recent losses, helping identify overbought or oversold conditions.
What if RSI is 20?
If the RSI is 20, it indicates that the asset is potentially oversold, suggesting that it might be undervalued and could be due for a price correction or reversal to the upside.
Is RSI 55 good?
An RSI of 55 is considered neutral to slightly bullish. It suggests that the asset is in a relatively balanced state, with a slight upward momentum, but it is not strongly overbought or oversold. This can indicate a stable market with potential for continued moderate gains.
Should I sell if RSI is 90?
If the RSI is 90, the asset is extremely overbought, indicating a potential for a price pullback. This could be a signal to consider selling or taking profits, as a reversal may be likely.
What if RSI is 60?
An RSI of 60 indicates moderate bullish momentum. It suggests the asset is in an upward trend but isn’t overbought, so it may have room to continue rising. It’s generally seen as a neutral to slightly positive signal.
Should you buy when RSI is below 30?
When the RSI is below 30, the asset is considered oversold, which could indicate a buying opportunity if you expect a price rebound.
Is 70 RSI bad?
An RSI of 70 indicates that the asset is overbought, suggesting it might be due for a price pullback. While it’s not necessarily “bad,” it signals caution as the price could reverse soon.
Is 40 RSI good?
An RSI of 40 indicates slightly bearish momentum, suggesting the asset is closer to being oversold than overbought. It’s not necessarily “good” or “bad,” but it may signal caution as the trend could continue downward.
Best Crypto Exchange for Intermediate Traders and Investors
-
Invest in cryptocurrencies and 3,000+ other assets including stocks and precious metals.
-
0% commission on stocks - buy in bulk or just a fraction from as little as $10. Other fees apply. For more information, visit etoro.com/trading/fees.
-
Copy top-performing traders in real time, automatically.
-
eToro USA is registered with FINRA for securities trading.