
Bitcoin (BTC) revisited the $70,000 price zone in a bullish seven days, powered by macroeconomic indicators and overall positive sentiments in the cryptocurrency market. Finbold looked for insights on key support and resistance levels to watch for in the last week of May.
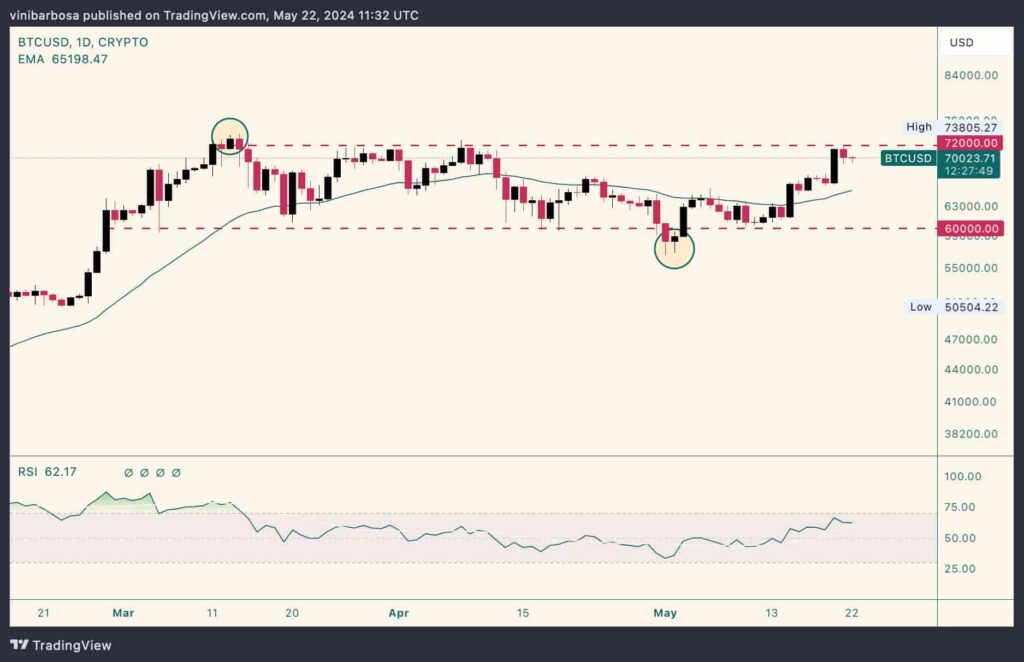
Notably, Bitcoin has been trading in a well-defined range since March, from $60,000 to $72,000. During this time, BTC has made two brief deviations—of two days each—from the price range. One in mid-March made an all-time high at $73,805, and the other in early May flash-crashed to $56,590.
Therefore, the $60,000 and the $72,000 levels remain the most important support and resistance to watch for. A breakout, followed by confirmation with increased volume, from any of these levels would bring a more aggressive move.
In the meantime, the $70,000 price makes a relevant psychological resistance that Bitcoin is currently testing. Moreover, the 30-day exponential moving average (30-EMA) has also been a key level, now making support at $65,200/btc.
Bitcoin on-chain data for key support and resistance levels
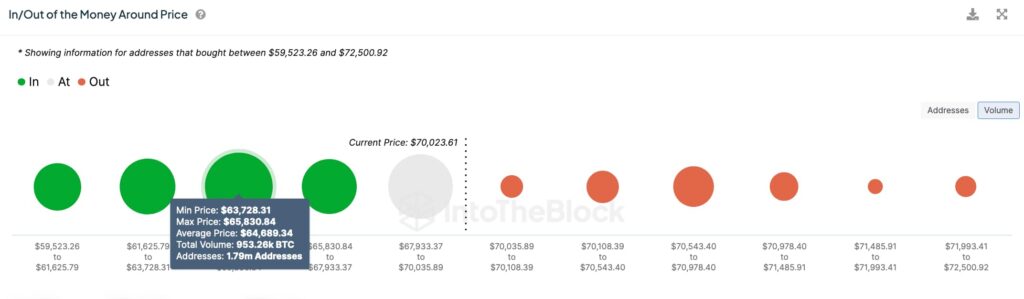
Looking further, Finbold gathered on-chain data from IntoTheBlock on May 22, which highlights other key levels to watch for.
In particular, the “In/Out of the Money Around Price” metric shows strong support at lower prices than current ones. The largest volume is within the $63,728 to $65,830 level, at an average of $64,689. 1.79 million addresses purchased over 953,260 BTC at these prices and are currently in profit.
On the other hand, there is no relevant volume to the upside, suggesting weaker resistance to the range’s top for BTC at above $72,000.
Is Bitcoin ready for new all-time highs?
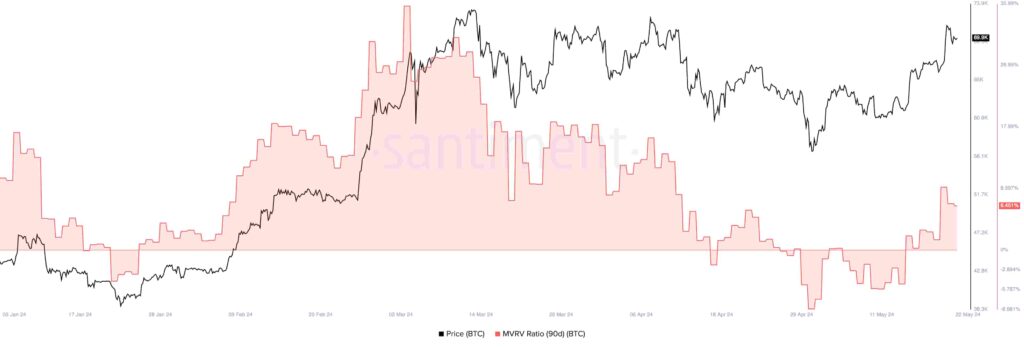
In this context, Finbold checked Bitcoin’s “Market Value To Realized Value” (MVRV) Ratio of the last 90 days on Santiment.
MVRV shows the ratio between the current price and the average price of every coin acquired. Essentially, higher ratios surge in potential resistance, foreshadowing increased selling activity, while the opposite is also valid to form support.
As of this writing, the 90-day MVRV ratio at 6% suggests a neutral outlook, with weak resistance at $70,000. Nevertheless, these prices have a proportionally low ratio compared to the 35% seen in March.
Hence, Bitcoin might make new all-time highs in the following days or weeks.
In conclusion, Bitcoin’s key support and resistance levels to watch are $60,000, $64,690, $70,000, and $72,000. The support levels are stronger than the resistance, which suggests a breakout to the upside. It is important, however, to understand that cryptocurrencies are highly volatile digital assets, and indicators are not conclusive.
Disclaimer: The content on this site should not be considered investment advice. Investing is speculative. When investing, your capital is at risk.