Support and resistance levels are two of the most common concepts in the technical analysis used in stock trading. If you are a beginner to technical analysis, support and resistance are the first indicators to know before using other trading tools.
This guide will explain what support and resistance levels are, how to accurately identify them, bring some examples, and list special considerations when using support and resistance.
Best Crypto Exchange for Intermediate Traders and Investors
-
Invest in cryptocurrencies and 3,000+ other assets including stocks and precious metals.
-
0% commission on stocks - buy in bulk or just a fraction from as little as $10. Other fees apply. For more information, visit etoro.com/trading/fees.
-
Copy top-performing traders in real time, automatically.
-
eToro USA is registered with FINRA for securities trading.
What is support and resistance trading?
In simple terms, support and resistance lines are used to identify when to buy and when to sell an asset, usually stocks or currencies, and at what price. These levels are usually temporary and short-lived but can also be long-lasting as markets receive new information.
Before we continue, let’s clarify some of the related terms:
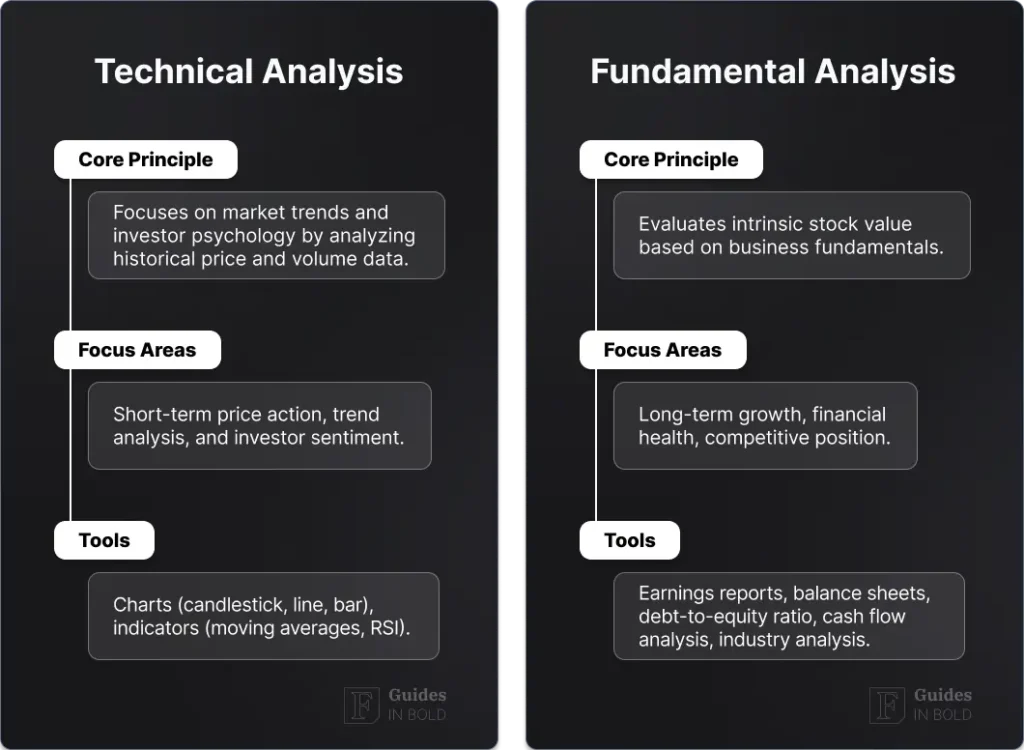
- Technical analysis is one of two main methods, along with fundamental analysis, used by investors to find new trading opportunities by analyzing past price and volume data on charts to forecast future price movements.
- A chart in technical analysis is a visual representation of the price and volume movements of an asset, common in stocks or forex markets, over a specific time – either one-day, one-month, or even yearly, year-to-date (YTD).
- Chart pattern or chart formation is a pattern on a chart that forms when looking at historical price data and volume or number of trades, used to identify these patterns and derive insights to forecast future prices.
Support and resistance lines are two separate lines or zones on a chart, which refer to two price points that act as barriers that prevent the price from moving up or down past these points.
Moreover, these levels aren’t necessarily completely horizontal and can also be slanted slightly up or down, depending on the overall price trend. Support indicates buying interest and is always below the current market price, and resistance shows selling interest, always above the current market price.
Beginners’ corner:
- What is Investing? Putting Money to Work
- 17 Common Investing Mistakes to Avoid
- 15 Top-Rated Investment Books of All Time
- How to Buy Stocks? Complete Beginner’s Guide
- 10 Best Stock Trading Books for Beginners
- 15 Highest-Rated Crypto Books for Beginners
- 6 Basic Rules of Investing
- Dividend Investing for Beginners
- Top 6 Real Estate Investing Books for Beginners
- 5 Passive Income Investment Ideas
Support definition
The support level is the minimum price of an asset that doesn’t drop beyond that point for a period of time because the purchasing power is sufficient. As the price of an asset gets closer to the support level, it also becomes more affordable in the process. In the buyers’ eyes, it is a better deal, and they are then more likely to buy. And if enough investors are purchasing the stock, it prevents the price from decreasing any further.
On the other hand, sellers are less likely to sell as the value has dropped. When this happens, demand (buyers) overcomes the supply (sellers), which will, in turn, stop the price from falling below the support level.
Resistance definition
The resistance level is the opposite of support – a maximum price an asset can reach and won’t exceed for some time. The number of sellers wanting to sell at that specific price prevents the value from climbing any higher. Meaning that the selling power (supply) is strong enough to stop the price from rising above it.
The rationale behind this is that if the supply (sellers) is higher than the demand (buyers), it will stop the price from going above resistance.
Simple support and resistance in stocks example
Traders can use support and resistance levels to determine whether to buy or sell; here’s a simple example to understand the concept of these two lines and how they are used by traders.
For example, Michael is a day trader who is interested in purchasing Apple (NASDAQ: AAPL) stock. He wants to know whether to take a long position and would use support and resistance levels on charts to identify this.
Michael decides to look at yearly price and volume data graphically visualized on a chart. He noticed that the price of Apple stock peaked at $160 over the last year; therefore, the $160 is its resistance level. He also saw that the price didn’t drop below $119 over the past year, which is then the support level.
With this information, Michael will wait until the next time the stock price drops close to $119 to place a trade and buy Apple stocks at the support level, assuming this is the lowest value he can purchase.
The idea behind these two lines may seem simple at first. However, you might find that after reading up more, the concept is slightly more difficult to grasp as these levels can come in many different forms.
How to read support and resistance?
Support and resistance can serve as potential entry or exit prices for the trade. As the price reaches the support or resistance line, there are two options – it will either bounce back as forecast, or a trend is broken. The price continues in the other direction until hitting a new support or resistance level.
Support and resistance levels help traders to:
- Determine the direction of the market;
- Find the best entry price in the market;
- Confirm the best exit price points at either a profit or loss.
After identifying support and resistance levels, traders should be able to answer all of the above points and enter a profitable trade.
Support and resistance levels are generally used for:
- Buying when the asset drops to support line;
- Selling when the asset increases to the resistance line;
- Buying when the asset breaks through a resistance line;
- Selling when the asset breaks down through the support line.
Psychological support and resistance levels
Support is when a downtrend – continuously decreasing prices – is expected to temporarily pause or reverse due to heightened demand, and resistance is when an uptrend – increasing prices – is expected to temporarily pause or reverse due to concentration on supply.
This sort of price behavior is often a consequence of market psychology and herd mentality, and when the majority of the market participants react to the price movements. For example, if the price of an asset drops, the demand for it increases, forming support.
If the price on a chart crosses the support level, it is a chance for investors to take a short position – as the price is expected to decrease, and if the price breaches the resistance level, it is an opportunity to take a long position – as prices are expected to go up again.
Ultimately, it is important to note that support and resistance levels can be subjective to each individual interpretation, as they can be applied in different time ranges and price points.
How to find support and resistance levels?
Several technical analysis indicators can be used to help identify the most important levels of support and resistance to speculate on where the prices might retrace.
Some of these indicators include trendlines, Fibonacci numbers, horizontal lines, and moving averages. What is more, individual traders often also develop their own style and strategy of how to find them, using a mixture of different tools.
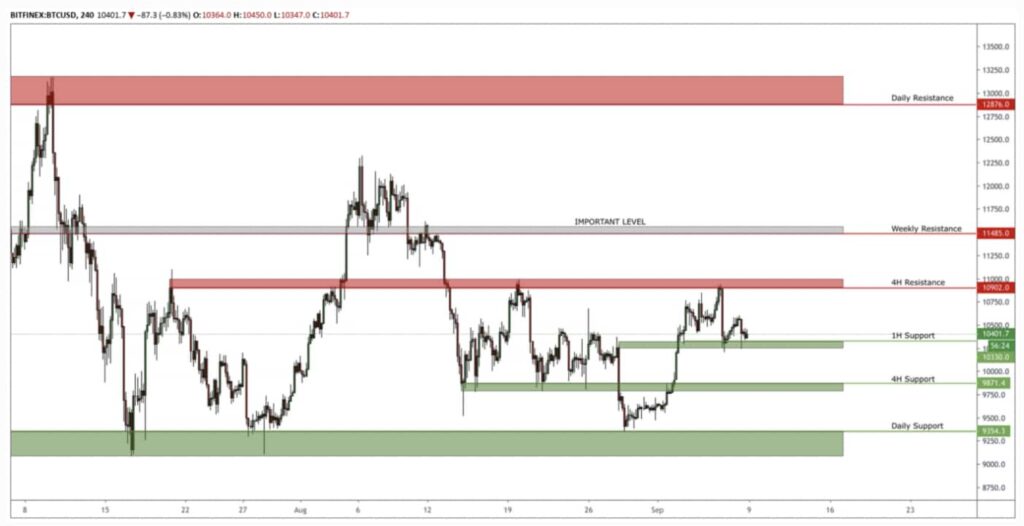
Moreover, higher frames are essential for correctly identifying the support and resistance areas. Whenever you draw the levels, as with any other part of your analysis, you should always start from a higher timeframe -— it has the biggest influence over the market.
Below is an example of different timeframes drawn on a chart:
Best indicators for support and resistance trading strategy
Various technical indicators can identify more advanced support and resistance areas, including trendlines, Fibonacci sequences, or moving averages.
1. Trendlines
Highlighting support and resistance levels with trendlines can help to identify the overall price trend and direction. This can be highlighted on the chart using straight lines that connect together several price points.
This visualization gives traders a good idea of where asset prices might move in the future. Trendlines can be used for support and resistance levels within any time frame and also show the speed of price movements and periods of price contractions.
In an uptrend, the price can form higher highs and higher lows; in a downtrend, the price makes lower lows and lower highs. Connecting highs and lows with a trendline can help to show where the price might find support and resistance in the future. For both, you should be able to draw at least two or more lows and highs to draw a trendline.
A horizontal line is drawn when the price stops or reverses in the same price area on two occasions in a row, a horizontal line is drawn, showing the market is struggling to break past that area. If it is a strong trend, the price will bounce off this trendline and continue to move in the same direction – look for any entries in line with the trend.
2. Moving averages in support and resistance
Moving averages (MA) are one of the best indicators for identifying support and resistance levels. A moving average appears on a chart as a curving line, used as dynamic support and resistance, as it is already plotted on the chart.
A simple moving average (SMA) is a calculation of a weighted average of a set of prices over a specific time. An exponential moving average (EMA) from the most recent time frame, like recent days, means it accounts for more up-to-date information and is, therefore, more accurate.
Popular moving averages are 20-day and 50-day periods as they are better suited for short-term trading (intraday or day), following prices with the most recent information. 100-day and 200-days are also used, however, more commonly by long-term traders.
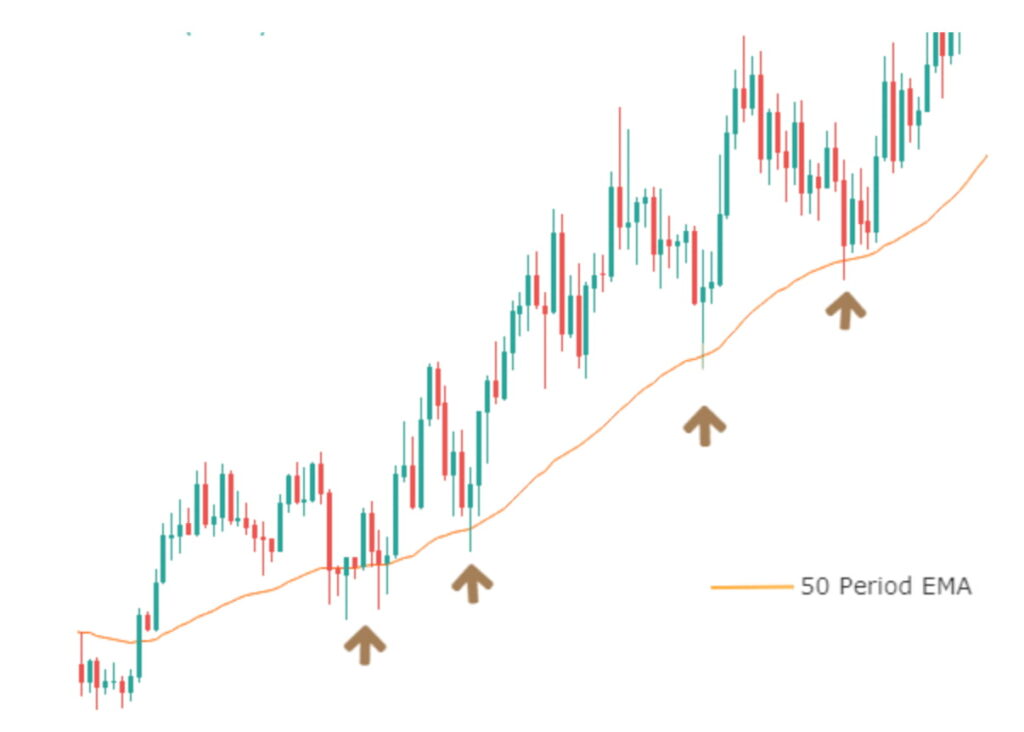
In the chart above, we can see that the market is continuously supported by the 50-period EMA, which acts as the support level. The 50 EMA has become the dynamic level of support.
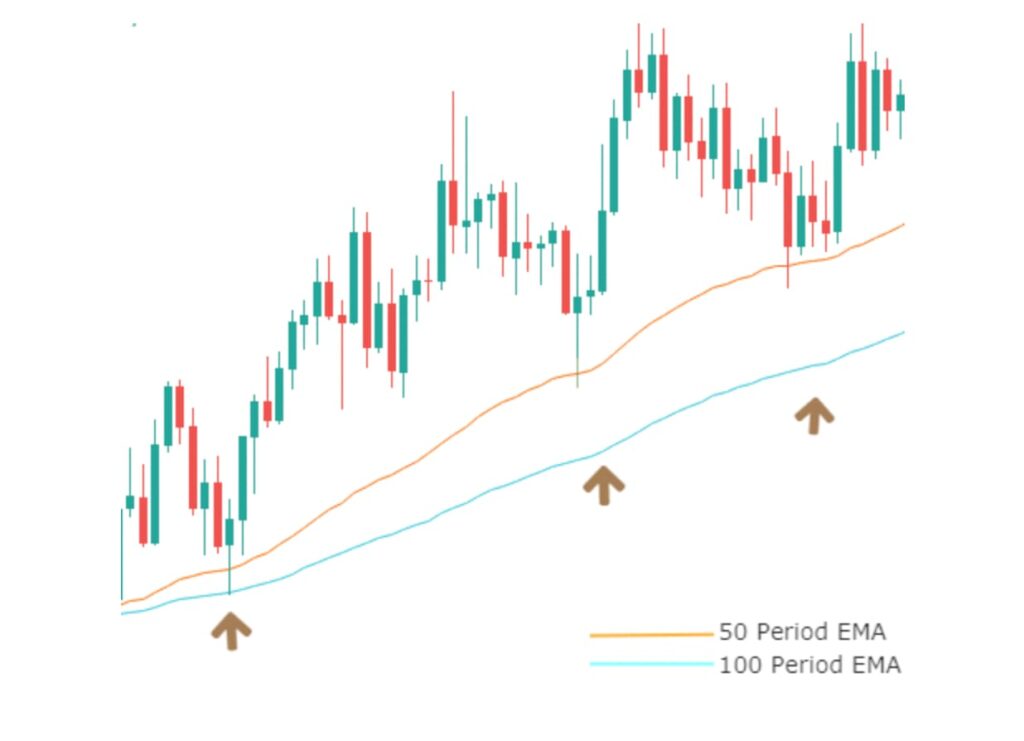
In the chart above, we can see both 50-period EMA and 100-period EMA. Similarly to identifying the “trading zones” between two support and two resistance levels, traders can identify zones between two moving averages. As you can see, the prices sometimes fall below 50 MA but never below 100.
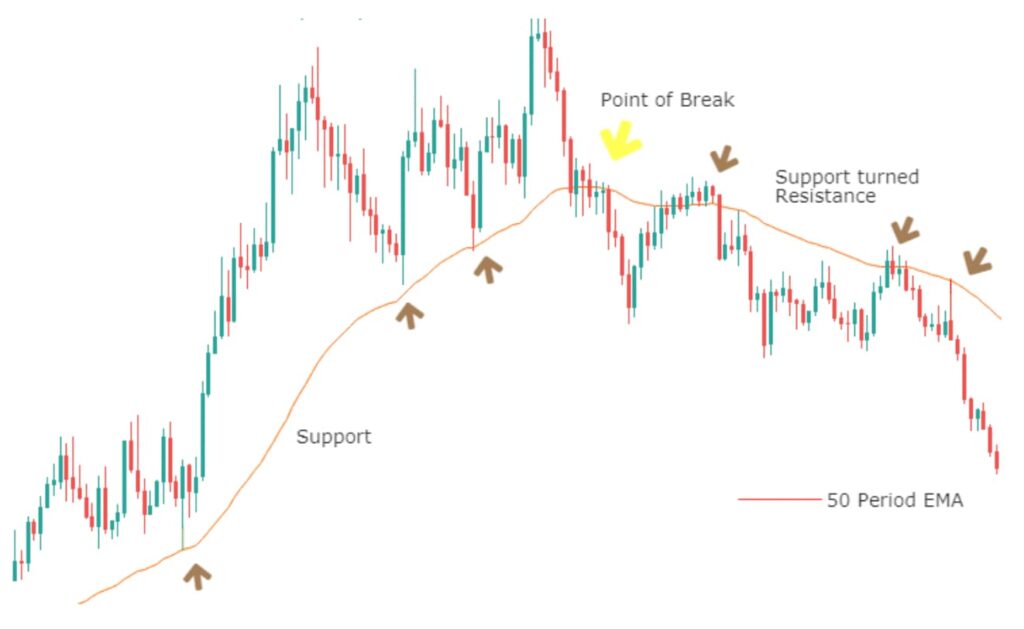
And lastly, on the above chart, we can see the 50-day moving average that has been acting as support reverse, becoming resistance.
Best Crypto Exchange for Intermediate Traders and Investors
-
Invest in cryptocurrencies and 3,000+ other assets including stocks and precious metals.
-
0% commission on stocks - buy in bulk or just a fraction from as little as $10. Other fees apply. For more information, visit etoro.com/trading/fees.
-
Copy top-performing traders in real time, automatically.
-
eToro USA is registered with FINRA for securities trading.
3. Fibonacci retracement levels
Using Fibonacci retracement levels is one of the best ways to spot potential resistance and support levels and conduct a precise technical analysis to know the best entry, exit, and target prices.
Fibonacci sequence is a series of numbers that result in a particular order by always adding the previous two numbers together, for example, 0, 1, 2, 3, 5, 8, 13, 21, 34, 55, 89, 144, etc., named after Italian mathematician Leonardo Fibonacci.
As an example, let’s take the retracement level of 61.8%. When we take one number divided by the next highest, it comes to .6180 (13/21=.6190, 34/55=.6181, 55/89=.6179, etc.) – all of the numbers approximate nearest to .6180, as the numbers go higher, which is the basis of the 61.8% retracement level.
Common Fibonacci retracement levels applied on charts in technical analysis are 23.6%, 38.2%, 50%, and 61.8%. 50% is also used, even though not a Fibonacci number. Here’s an example of how to combine support and resistance with Fibonacci levels:
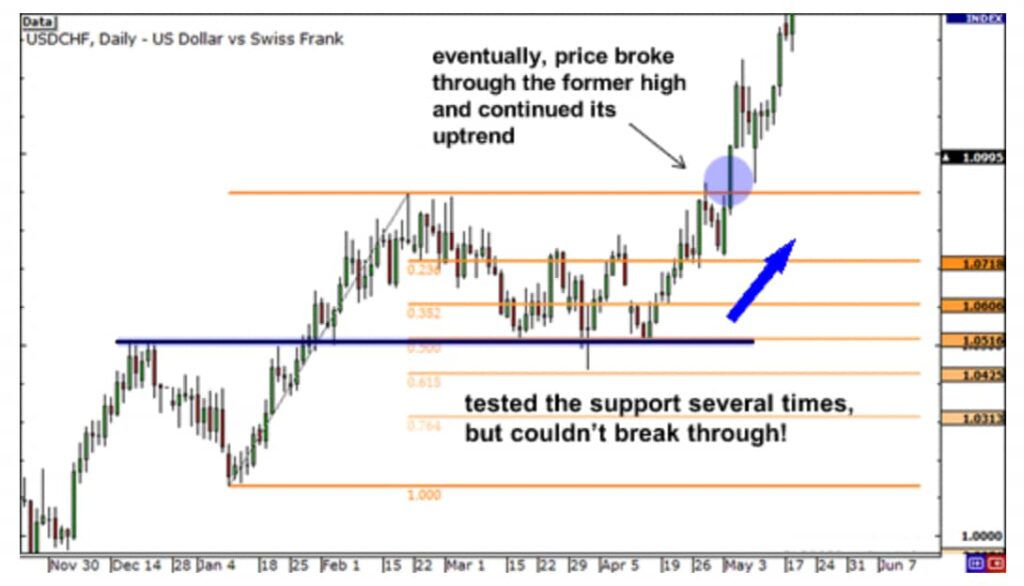
The above chart depicts price movements of support and resistance in the forex of a currency pair USD/CHF, where common Fibonacci retracement levels are applied. For example, once one Fibonacci level is broken, it is more likely the price will turn into support and be a good entry place.
Traders can leverage several of these common price areas, as many others are monitoring them as well, and the chance of price bouncing from them is higher.
4. Round numbers
Another way to identify support and resistance levels is by tracking whole number levels such as 10, 20, 30, 40, 50, 100, or 1000. This strategy is based on market psychology – as a large proportion of traders tend to set their stop levels and profit targets around whole numbers, these price points have more people entering the market.
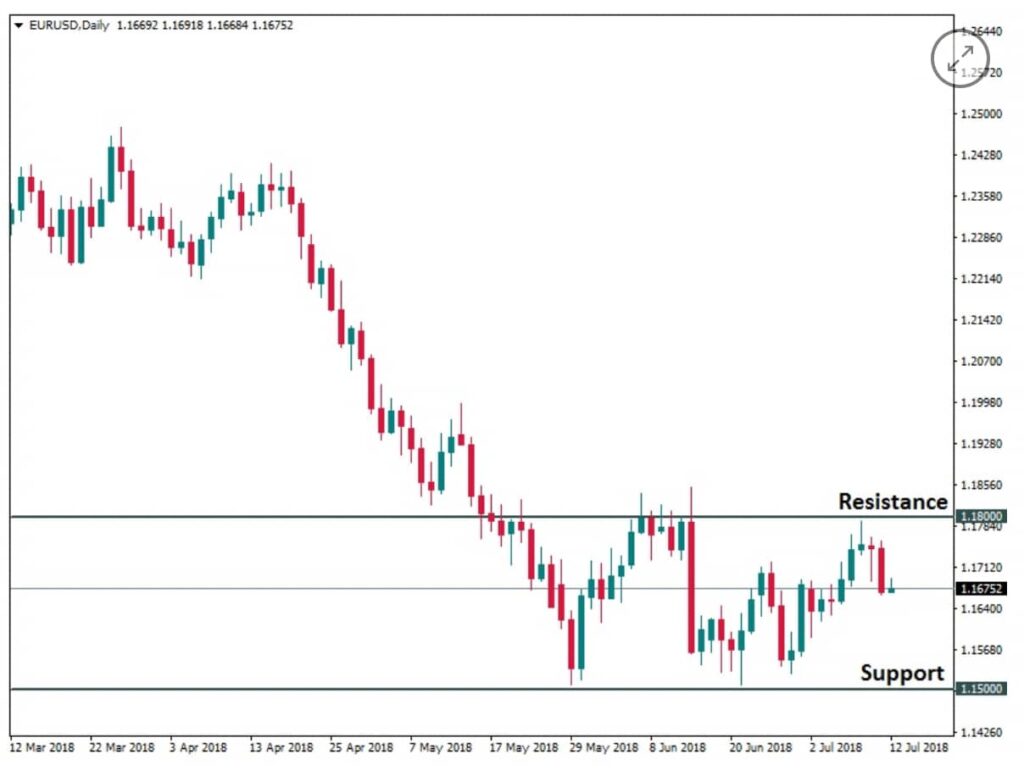
For example, on the above chart, we can see that support and resistance lines formed at 1.1800 and 1.1500 levels, which is probably as more people entered at round numbers.
Most traders would place an order at an exchange rate of 1.00 rather than 1.578 or purchase a stock at $40 rather than $41.56. Because so many orders are placed on the same levels, round numbers tend to act as barriers because a strong level of resistance or support is created.
5. Support and resistance trading ranges or zones
Support and resistance levels aren’t always just a perfectly straight line, and it can happen that prices bounce off a particular area rather than a specific price point. Instead of one line, a range appears because there’s no clear indication of a trend.
Where the price of an asset or security trades within a range but doesn’t form a distinct trend over some time – forming no bull or bear run – happens in the sideways market.
That’s why traders use a range trading strategy – ranges can be identified between support and resistance levels. Rectangles or trading ranges are common and can last for a short period to several years, seen on both intra-day but also longer time frames.
But first, you need to identify the areas on a stock chart.
How to draw support and resistance zones?
Step 1 — On the chart, choose either daily, weekly, monthly, or any other time frame according to your trading needs.
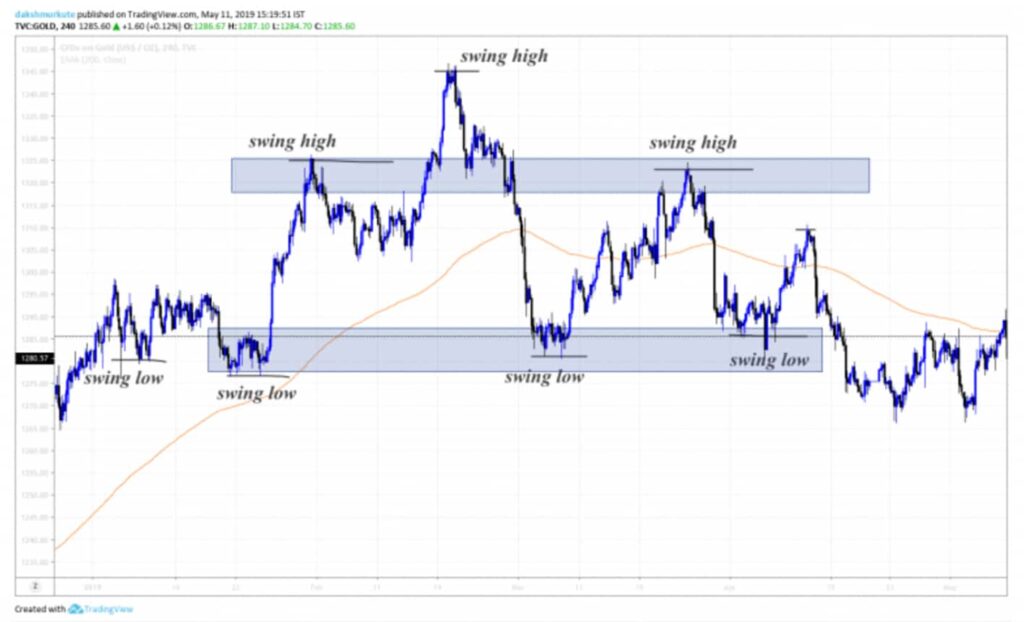
Step 2 — Look for areas where a pierce reversal happened, and mark those swing highs and lows.
Step 3 — Use a rectangle tool and cover all swing highs and swing lows. Only cover price points that are in a line – this zone is your support and resistance. What is more, you always need two or more swings in one zone for the zone to be valid.
Step 4 — When done with a higher time frame, move to lower time frames and repeat.
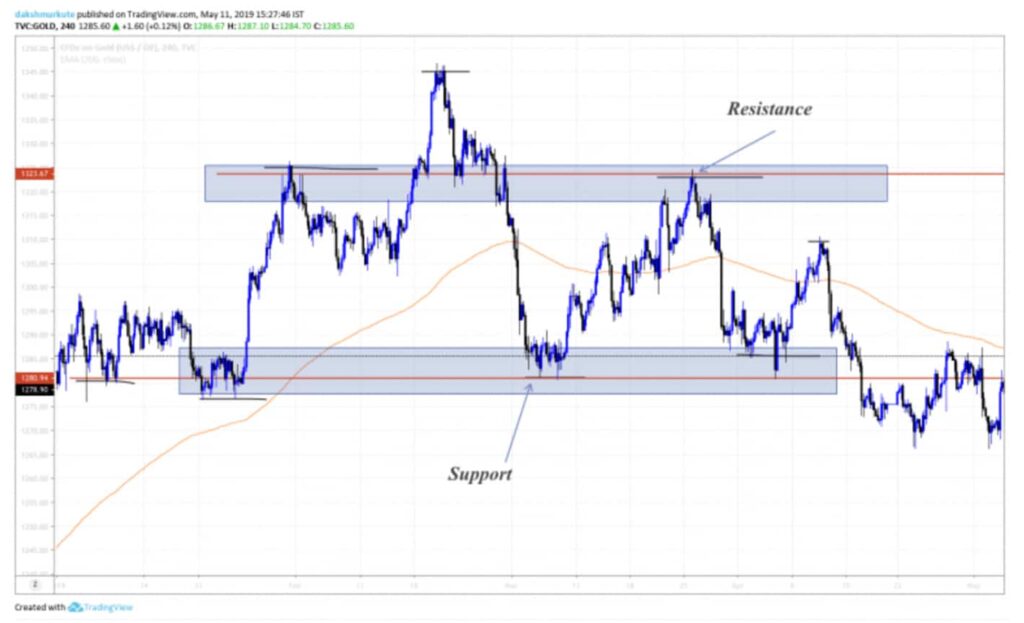
Mark swing highs and swing lows:
Connect all swing highs and swing lows with a horizontal line:
Support and resistance trading strategy considerations
Some of the key aspects to consider when using support and resistance levels in your trading strategy:
- Look at a higher timeframe, but do your trading at a lower timeframe;
- Wait on a trend reversal;
- Look at previous most recent resistance or support levels to see how low or high the price could possibly go;
- If trying to identify a counter-trend in support and resistance, look for the most recent levels that reached that price at least twice before. If the trend goes the other way, look at other multiple tested price levels for where the price could reach. Traders often use multiple support and resistance levels in multiple time frames to estimate where prices could go;
- Look for 1-2-3 moves; they are often followed by a reversal. If the price breaks through previous support or resistance, place short or long trades within this period of the support area accordingly.
In conclusion
Support and resistance levels are two key concepts used in technical analysis. Being able to accurately determine these two levels is important to improve the profitability of trades and your short-term trading strategy.
Regardless of the method used, the bottom line is – it shows the likely highest and lowest price of an asset, and is used for identifying best trade entry and exit prices and times, e.g., the best price and time to sell or buy.
Disclaimer: The content on this site should not be considered investment advice. Investing is speculative. When investing, your capital is at risk.
FAQs of support and resistance trading
What is support and resistance?
Support and resistance are two core technical analysis tools used to assume future prices of stocks or other assets, commonly applied in forex markets, stocks, and cryptocurrencies. These two levels indicate the lowest and highest price points an asset could drop or increase over some time, helping traders know when to buy and when to sell, and at what price.
How to find support and resistance?
Support and resistance levels are identified on a chart by using various other technical indicators, such as the Fibonacci sequence, moving averages, trendlines, or support and resistance trading zones.
Does support and resistance actually work?
Yes, support and resistance levels are two of the best and most commonly used technical analysis tools that help assume the best trade entry and exit prices. However, as with any other technical analysis indicators and patterns, support and resistance lines can be subjective, as they are applied on charts by individual traders differently and between various time ranges.
What happens when support and resistance meet?
When the two prices meet, consolidation between support and resistance – called support and resistance reversal happens. It is when the price of the asset finally breaks through and increases beyond the identified resistance level, or vice versa, and becomes the new resistance.
Which time frame is best for support and resistance?
As with any other part of your analysis, starting from a higher timeframe is best. This helps to find the most accurate support and resistance levels, as higher time frames have the largest influence over the market. After identifying support and resistance areas over a longer time, concentrate on shorter timelines.
What is support and resistance in forex?
Support and resistance in forex work the same way as in support and resistance in stocks. Support is the “floor” price – when the prices that have been dropping reach the lowest level and stop for some time. Resistance is the maximum price level a currency price can climb before stopping for some time and starting to fall again.
How do you recognize support and resistance?
To recognize support and resistance, observe price charts for repeated levels where the price struggles to move below (support) or above (resistance). Support is identified by a series of lows around the same level, while resistance is identified by a series of highs around the same level. Tools like trendlines, moving averages, and technical indicators can help pinpoint these levels more accurately.
Best Crypto Exchange for Intermediate Traders and Investors
-
Invest in cryptocurrencies and 3,000+ other assets including stocks and precious metals.
-
0% commission on stocks - buy in bulk or just a fraction from as little as $10. Other fees apply. For more information, visit etoro.com/trading/fees.
-
Copy top-performing traders in real time, automatically.
-
eToro USA is registered with FINRA for securities trading.