
Bitcoin (BTC) has been on a slow recovery since mid-March. Moves to the upside are limited, and at present, involve multiple unsuccessful attempts to breach local resistance levels before a decisive break ultimately occurs.
The leading cryptocurrency, which was trading at $86,470 at press time, is down 9.74% since the start of the year.
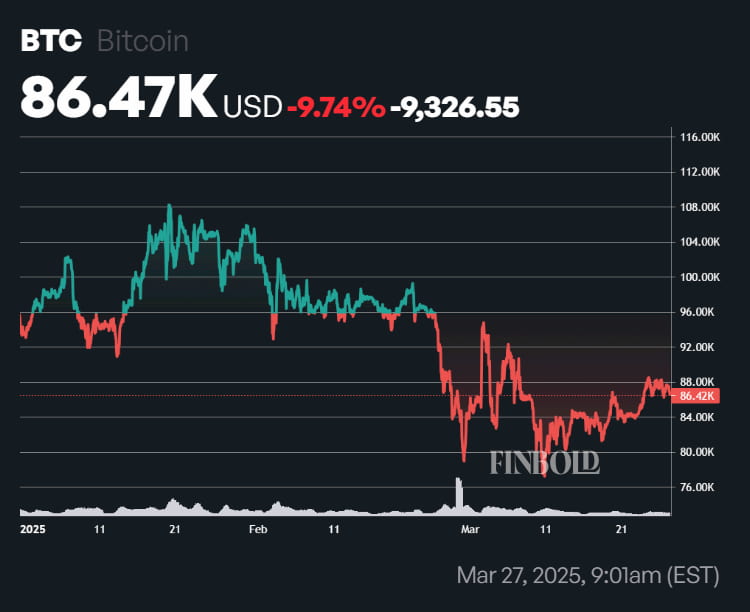
Prices have bounced off of resistance between $88,470 and $88,200 three times in the past week, while a level of support has been established in the $86,220 to $86,460 range.
Despite the occasional spike in short positions, data suggests that long-term BTC holders, who have significantly reduced their liquidations since the start of the year, maintain a strongly bullish outlook.
On the whole, however, sentiments surrounding BTC’s near-term prospects remain mixed. A closer look at the Bitcoin Rainbow Chart could reveal additional insights.
Bitcoin Rainbow Chart analysis
The Bitcoin Rainbow chart is a visual tool that leverages a logarithmic growth curve overlaid over price action to describe investor sentiment. It is divided into nine color-coded zones, each of which corresponds to a specific price range at any given time.
These descriptively-named color-coded zones range from ‘Bitcoin is dead’ at the low end to ‘Maximum Bubble Territory.’
At present, prices are at the higher end of the fourth zone from the bottom, in the ‘Still Cheap’ zone. A move above $92,411 would place the cryptocurrency in the ‘HODL!’ zone.
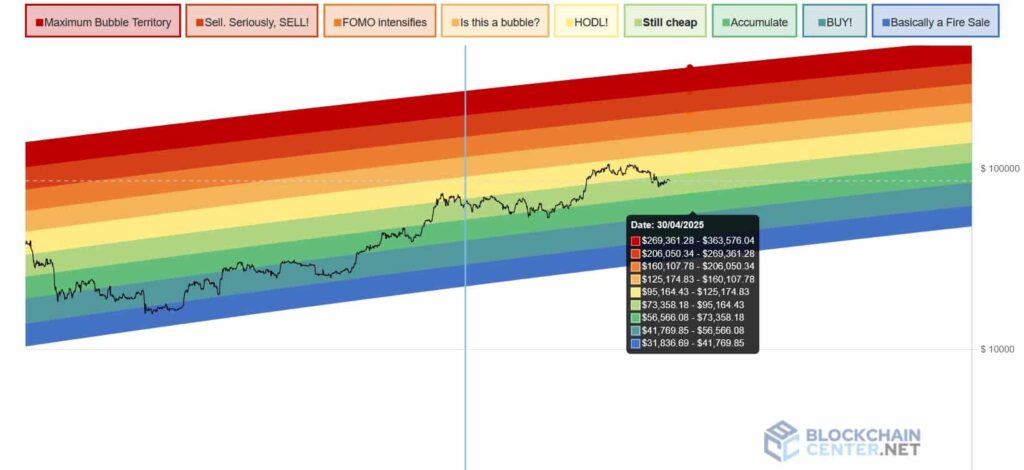
So, what can the colorful logarithmic growth curves of the Bitcoin rainbow chart tell us? For BTC to stay in the ‘Still Cheap’ zone on April 30, it would have to trade in the $73,358 to $95,164 range. Those two figures correspond to a 15.16% downside and 10.05% upside, respectively.
Should sentiment turn more bullish, the cryptocurrency could find itself in the ‘HODL!’ zone — which would equate to the $95,164 to $125,174 range at the end of April.
In contrast, if the digital asset’s price falls below $73,358 by that point, a more attractive opportunity for investors looking to go long will have appeared.
What is the most likely outcome? Since the start of the year, BTC has been either in the ‘Still Cheap’ or ‘HODL’ zones. In addition, both breaking above local resistance and even retesting the asset’s all-time high (ATH) price of roughly $108,000 would place it firmly within the ‘HODL!’ zone. Therefore, the $95,164 to $125,174 range appears to be the most realistic forecast for April 30.
Featured image via Shutterstock