
The Bitcoin Rainbow Chart is projecting a wide and clearly structured price range for BTC as the market approaches January 1, 2026.
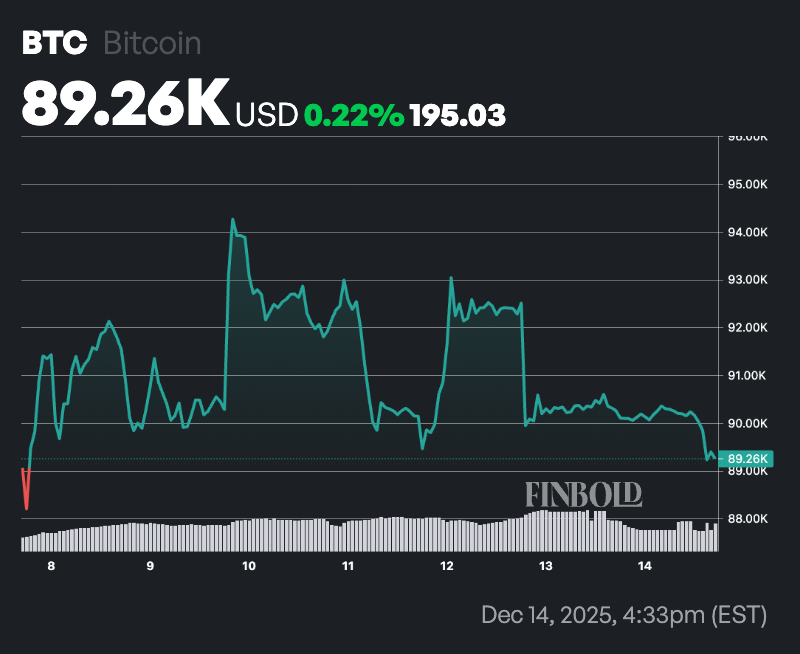
Notably, the outlook comes as Bitcoin (BTC) faces renewed bearish pressure that has seen the asset slip below the $90,000 level.
In this context, as of press time, Bitcoin was changing hands at $89,257, down more than 1% over the past 24 hours. On a weekly basis, the leading cryptocurrency has gained less than 1%.
Regarding the price outlook, the Rainbow Chart uses a logarithmic growth model to evaluate Bitcoin’s price across color-coded bands that reflect historical market sentiment, valuation extremes, and cycle positioning.
Bitcoin price prediction
As of its January 1, 2026 projection, BTC sits in the lower-middle valuation zones, suggesting it is neither overheated nor deeply undervalued.
The chart plots Bitcoin’s price on a logarithmic scale and fits a long-term regression curve tied to adoption-driven growth rather than short-term volatility. Each color band represents a deviation from this trend, providing context within past market cycles. Importantly, the model does not predict exact tops or bottoms but instead highlights probabilistic valuation ranges based on historical behavior.
For January 1, 2026, the chart projects that Bitcoin’s price could fall within the’Basically a Fire Sale’ band, spanning roughly $39,700 to $51,980, a range historically associated with extreme undervaluation and late bear-market conditions.
Above it, the ‘BUY!’ band ranges from about $51,980 to $70,125, a zone that has often aligned with strong long-term accumulation opportunities. The ‘Accumulate’ band sits between approximately $70,125 and $90,650, closely aligning with Bitcoin’s current price and indicating fair value within the broader growth curve.
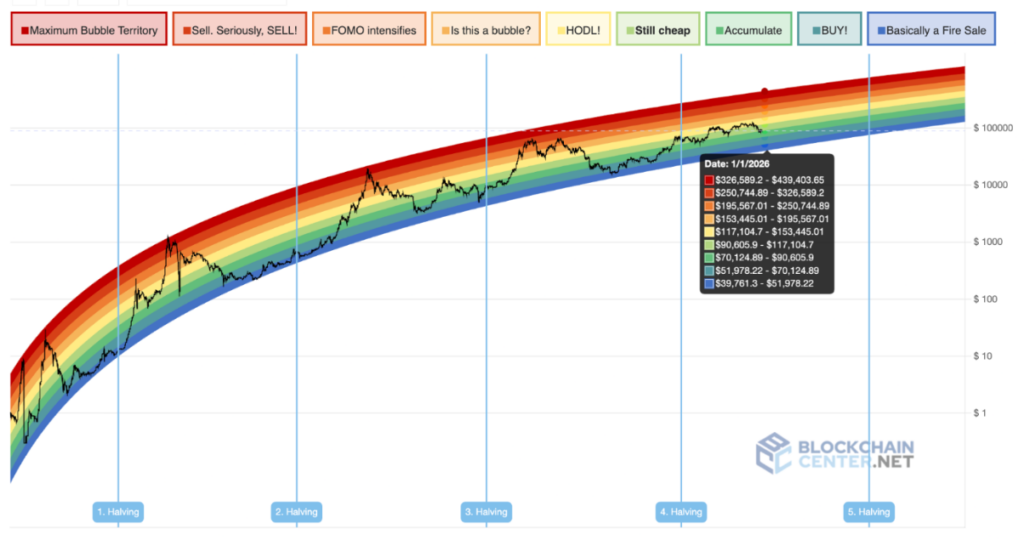
The light green ‘Still Cheap’ band extends from around $90,650 to $117,105, suggesting moderate upside if Bitcoin continues to track its historical adoption trend. Above that, the ‘HODL!’ band ranges between $117,105 and $153,445, a level typically associated with strong bullish momentum without speculative excess.
Meanwhile, the ‘Is this a bubble?’ band rises from about $153,445 to $195,567, reflecting conditions where prices have historically begun to detach from long-term averages. The ‘FOMO intensifies’ band spans approximately $195,567 to $250,745, signaling heightened speculative behavior.
Beyond that, the ‘Sell. Seriously, SELL!’ range runs from around $250,745 to $326,589, while the ‘Maximum Bubble Territory’ band stretches from roughly $326,589 to about $439,404, levels historically linked to major cycle peaks.
Bitcoin’s ideal price for Jan 1, 2026
Given Bitcoin’s current price of approximately $89,200, the Rainbow Chart suggests that by January 1, 2026, BTC is most likely to trade between roughly $90,000 and $117,000 under neutral conditions, with a move toward $153,000 possible if bullish momentum strengthens.
Conversely, even a significant breakdown below the trend would still place long-term structural support well above $50,000 according to the model.
Featured image via Shutterstock