
After a flurry of renowned institutional investors filed for launching a spot Bitcoin (BTC) exchange-traded fund (ETFs) earlier this week, Bitcoin attracted strong optimism, propelling its price above the $30,000 milestone for the second time in 2023.
Curious about its future trajectory, investors and market analysts are now eagerly anticipating the extent to which Bitcoin’s current rally can expand, as the digital currency continues to captivate the financial world with its evolving potential.
Seeking further insights, Finbold analyzed BlockchainCenter’s rainbow price chart – a tool that illustrates the world’s biggest cryptocurrency’s historical movements in relation to different moving averages (MA).
Per the chart, BTC has just entered the ‘Accumulate’ phase, which presently stands in the price area between $29,895 and $39,198, data retrieved on June 23 showed.
Prediction for January 1, 2024
Bitcoin rainbow chart utilizes a logarithmic growth curve to offer projections for the potential future price direction of BTC. To do this, the tool overlays rainbow color bands on top of the curve in a bid to highlight market sentiment at each rainbow color stage as the price reaches it, thereby bringing attention to different bullish or bearish scenarios.
As for its end of 2024 beginning forecast, the best possible scenario for Bitcoin is called the “Maximum Bubble Territory.” Indicated by a dark red color, this territory identifies a price area from $180,467 to $245,226, compared to the most bearish scenario (dark blue) from $20,056 to $26,152 on January 1, 2024.
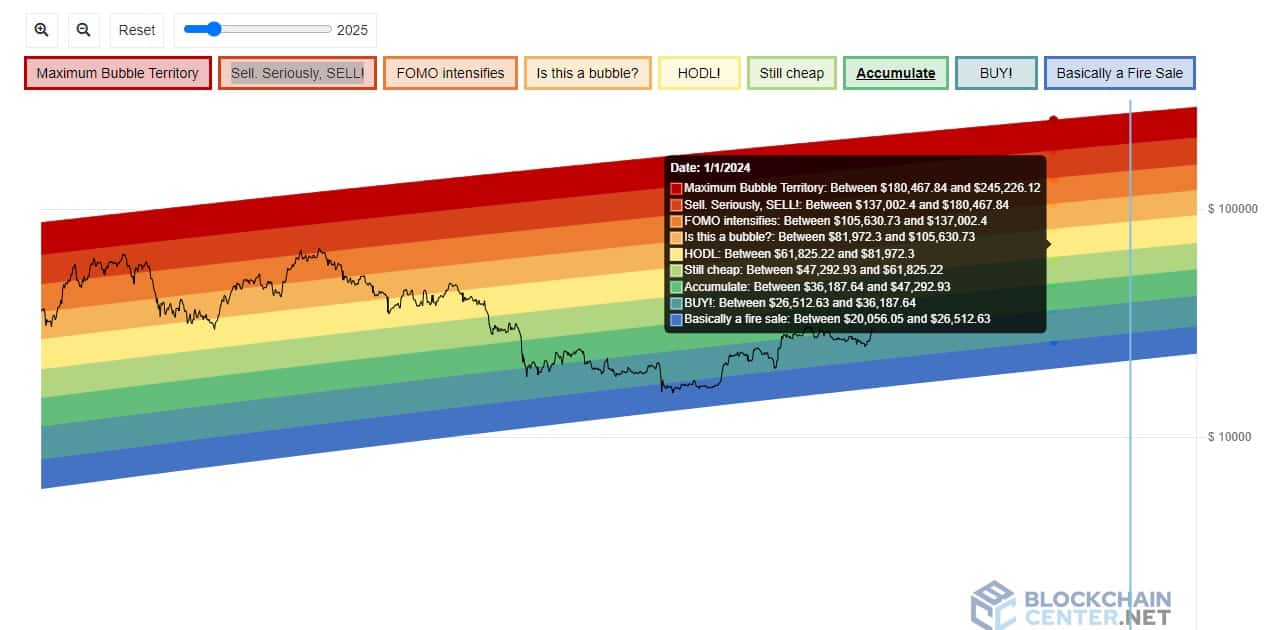
That said, if Bitcoin’s price is to repeat its earlier patterns, it implies that the leading crypto asset could indeed end up close to the most bullish area by 2024. The same scenario occurred in 2017, when BTC skyrocketed from the ‘Accumulate’ stage in May to the ‘Maximum Bubble Territory’ in December, before slightly dropping to the ‘Sell. Seriously, SELL!’ zone (red) at the beginning of 2018.
Bitcoin price analysis
At press time, Bitcoin’s price was trading at $30,019, down 0.19% on the day. Over the past week, the crypto asset gained more than 17%.
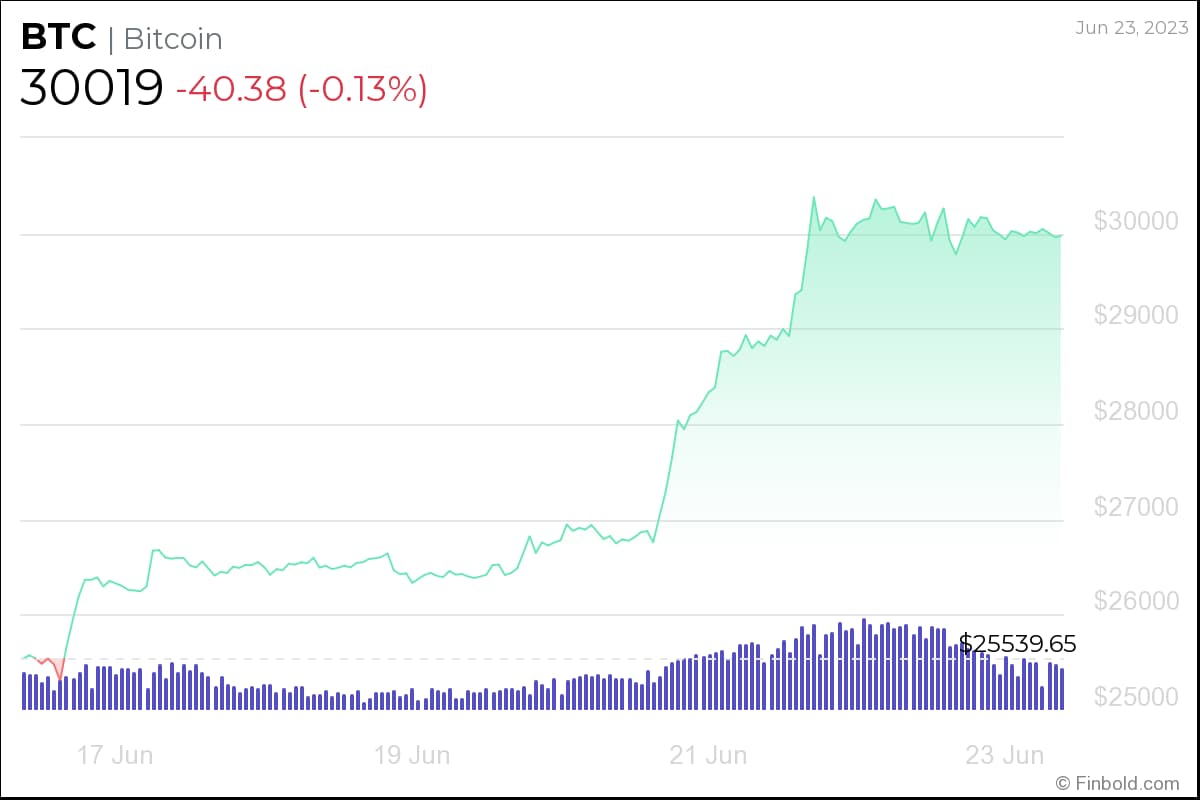
Year-to-date, BTC soared by more than 80%, marking an impressive recovery after the extreme crypto winter in 2022.
Over the past 11 weeks, Bitcoin whales – investors who hold between 1,000 and 10,000 BTC – have accumulated a combined 131,600 BTC, Finbold reported on June 20.
Disclaimer: The content on this site should not be considered investment advice. Investing is speculative. When investing, your capital is at risk.