Skip to content

No results found

To keep going please Log in.

or

By submitting my information, I agree to the Privacy Policy and Terms of Service.

To keep going please Log in.

or

By submitting my information, I agree to the Privacy Policy and Terms of Service.

To keep going please Log in.

or

By submitting my information, I agree to the Privacy Policy and Terms of Service.

To keep going please Log in.

or

By submitting my information, I agree to the Privacy Policy and Terms of Service.

Bitcoin’s most predictable technical line sets BTC’s next low before rally

Bitcoin’s most predictable technical line sets BTC’s next low before rally
Paul L.

A long-term Bitcoin (BTC) technical structure is hinting at possible near-term losses ahead of a major rally, as the asset continues to hold above the $70,000 level.

In this line, analysis of the weekly chart shows a decade-long ascending trendline, often called a “parabolic guard”, that has consistently underpinned Bitcoin’s biggest bull runs, linking key macro lows and repeatedly acting as a launchpad for strong rallies. 

Historical data shared by cryptocurrency analyst Ali Martinez in an X post on April 11 indicates that each test of this rising support has been followed by outsized gains. 

Bitcoin price analysis chart. Source: Ali Martinez

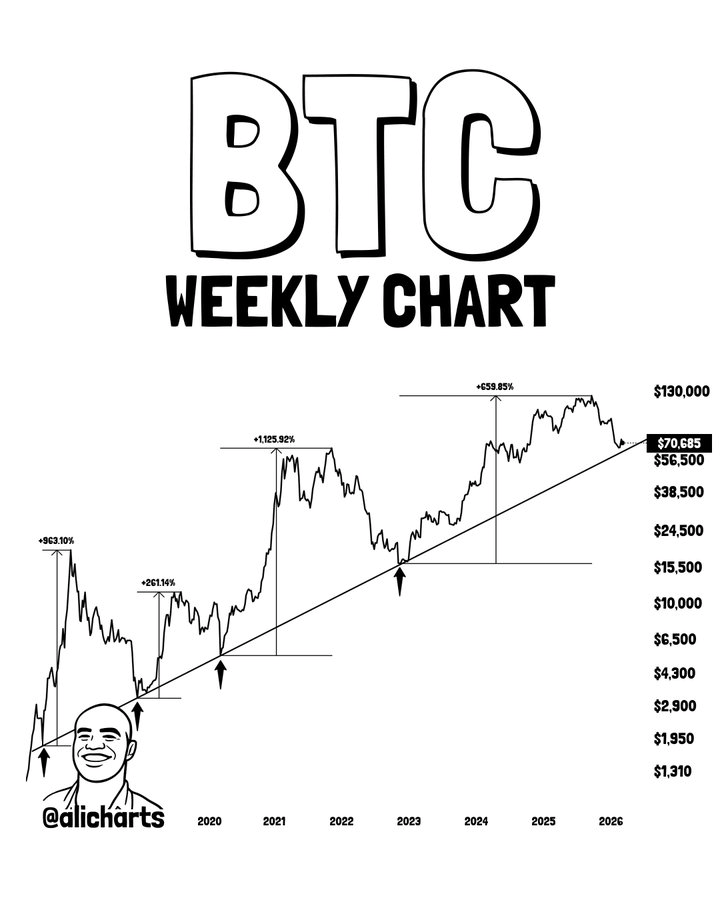
In past cycles, rebounds from this level preceded moves of roughly 963% in 2017, about 261% in 2018, over 1,100% in 2020, and around 660% after the 2022 touchpoint.

These repeated reactions reinforce the trendline as one of Bitcoin’s most reliable long-term indicators. 

Notably, the current setup shows price approaching this ascending support, with a projected touch zone between $56,000 and $60,000, as it consolidates and then compresses while maintaining a broader uptrend with higher highs and higher lows.

The trendline’s upward slope suggests each cycle is forming at higher valuations. Recent price action shows Bitcoin pulling back from highs near at $126,000 toward this support, in line with past corrections that preceded renewed rallies. 

While not guaranteed, the consistency of this trendline makes it a key level, with the coming weeks critical in determining whether Bitcoin respects this support and rebounds.

Bitcoin price analysis 

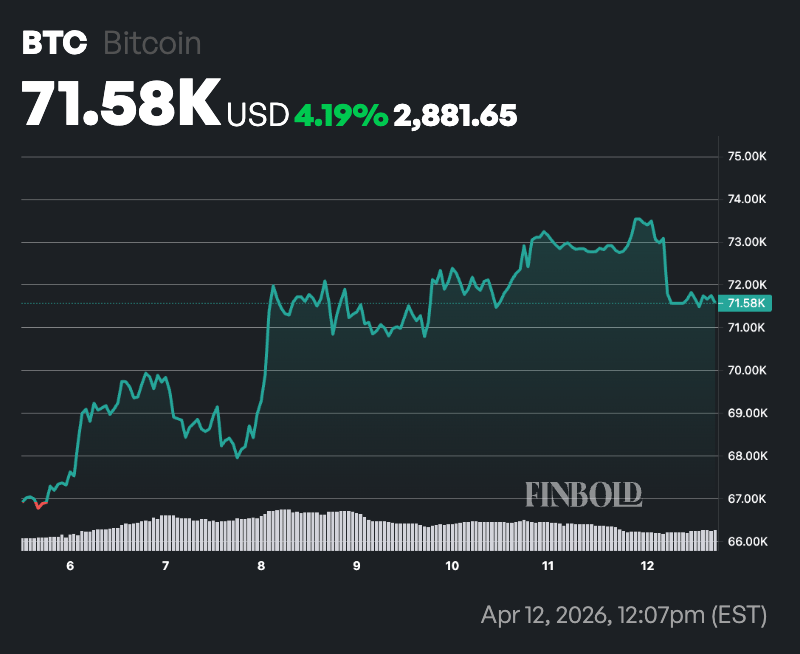
By press time, Bitcoin was trading at $71,580, down about 1.5% over the past 24 hours but still up more than 4% on the week.

Bitcoin seven-day price chart. Source: Finbold

Technical indicators remain mixed, with short- and long-term momentum diverging. The price is trading above the 50-day SMA at $69,505, suggesting near-term support, but remains well below the 200-day SMA at $89,298, indicating the broader trend is still under pressure.

The 14-day RSI stands at 61.58, reflecting neutral-to-moderately bullish momentum without entering overbought territory. 

This leaves room for further upside, though the lack of stronger momentum points to ongoing uncertainty. Overall, while short-term signals suggest stabilization, the longer-term structure has yet to confirm a sustained bullish reversal.

Best Crypto Exchange for Intermediate Traders and Investors

  • Invest in cryptocurrencies and 3,000+ other assets including stocks and precious metals.

  • 0% commission on stocks - buy in bulk or just a fraction from as little as $10. Other fees apply. For more information, visit etoro.com/trading/fees.

  • Copy top-performing traders in real time, automatically.

  • eToro USA is registered with FINRA for securities trading.

30+ million Users worldwide
Securities trading offered by eToro USA Securities, Inc. (“the BD”), member of FINRA and SIPC. Cryptocurrency offered by eToro USA LLC (“the MSB”) (NMLS: 1769299) and is not FDIC or SIPC insured. Investing involves risk, and content is provided for educational purposes only, does not imply a recommendation, and is not a guarantee of future performance. Finbold.com is not an affiliate and may be compensated if you access certain products or services offered by the MSB and/or the BD
Finbold Career

Join Finbold's newsroom, become a crypto reporter today!

Apply now to join Finbold as a crypto/finance news writer!

Latest posts

Finance Digest

By subscribing you agree with Finbold T&C’s & Privacy Policy

Related posts

Finbold AI Agent

How AI Price Predictions Work

We use cutting-edge AI models to forecast future prices for stocks and crypto.

Home

No results found

IMPORTANT NOTICE

Finbold is a news and information website. This Site may contain sponsored content, advertisements, and third-party materials, for which Finbold expressly disclaims any liability.

RISK WARNING: Cryptocurrencies are high-risk investments and you should not expect to be protected if something goes wrong. Don’t invest unless you’re prepared to lose all the money you invest. (Click here to learn more about cryptocurrency risks.)

By accessing this Site, you acknowledge that you understand these risks and that Finbold bears no responsibility for any losses, damages, or consequences resulting from your use of the Site or reliance on its content. Click here to learn more.