
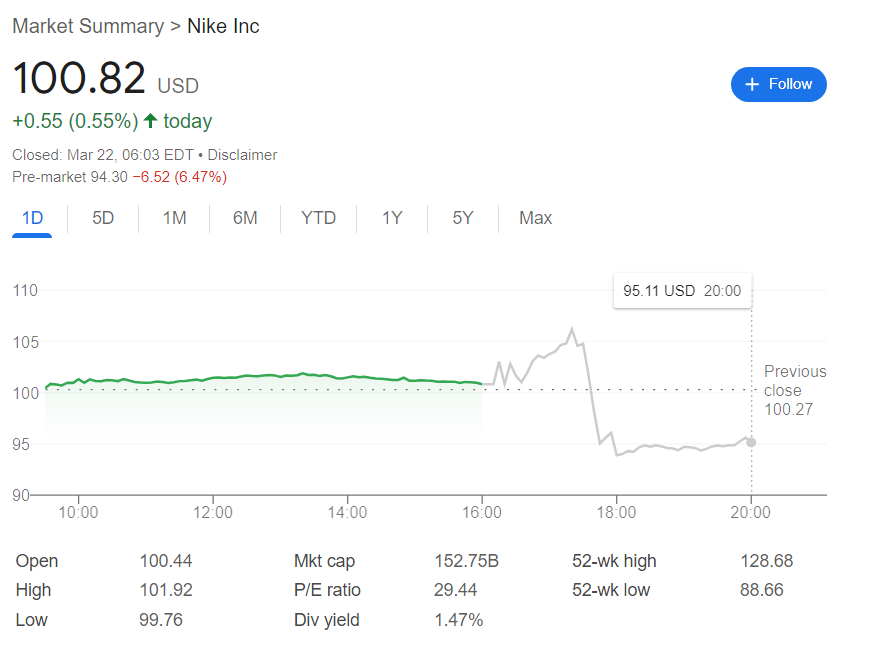
Despite what its namesake might indicate, Nike Inc. (NYSE: NKE) has suffered a string of significant defeats in the last few days leading to an abysmal extended session performance that saw NKE shares dip 6.47% in the night between March 21 and 22 to below $100.
In the U.K. the clothes manufacturer sparked controversy and even calls for a boycott over a nation-unifying change to the design of the Cross of St. George on the kit of England’s national football – soccer, depending on which side of the Atlantic one is on – team.
The ancient flag – featuring “argent, a cross gules,” or a red cross on a white field as most would describe it – was updated into a red, purple, blue, and black cross.
Picks for you
The change sparked outrage and numerous negative comments with multiple calls – including from the Labour leader, Sir Keir Starmer – to restore the original version of the kit that is to be used in the upcoming Euro 2024 tournament.
While the outrage wasn’t entirely to blame for the stock market slump for Nike, it added to the company’s many current woes.
Nike publishes shaky 2024 outlook
The second, and possibly more important reason for the extended session fall came in the form of Nike’s outlook for 2024 published along with the firm’s most recent earnings report.
At face value, Nike did well in the most recent full quarter beating earnings per share (EPS) expectations and the U.S. sales growth forecasts.
The persistent slowdown in the growth of its business in China spooked investors, however, and a 3% revenue decline in the EU, the Middle East, and Africa contributed significantly to the decline.
Nike’s shaky outlook for 2024 also did little to help the matter as it forecast a limited 1% revenue growth in 2024 and an unspecified revenue growth in 2025.
The clothing giant’s future is also uncertain as its major restructuring effort aimed at cutting costs by as much as $2 billion likely accounted for much of the company’s ability to slightly beat expectations in the most recent reported period.
Nike stock price chart
Even if the extended session performance is excluded, Nike has been struggling in the stock market in recent months. NKE shares fell 15.63% in the last 52 weeks and are 5.38% in the red year-to-date.
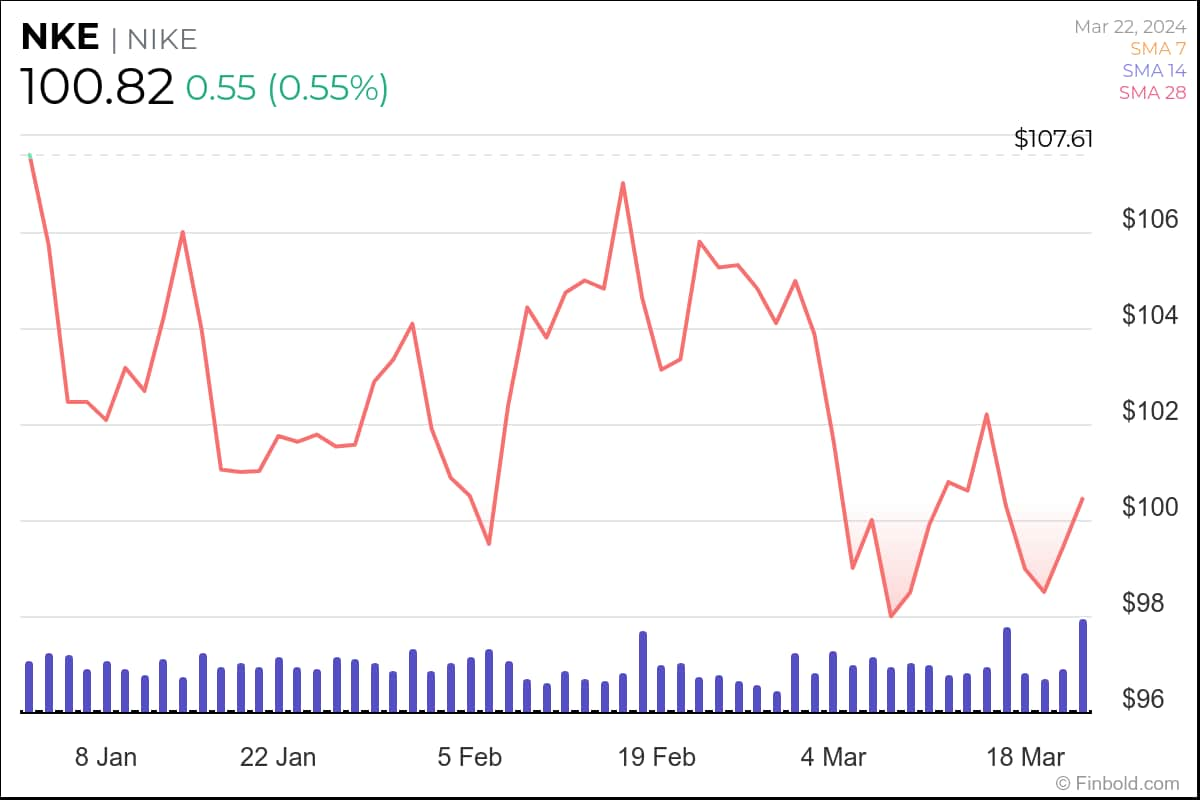
Nike’s more recent performance is similarly lackluster. The last 30 days of trading saw a 4.05% decline while the weekly and the daily chart show some limited investor optimism in the lead-up to the earnings report – though not in the reaction to the report – as the firm was 0.52% and 0.55% in the time frames respectively.
At the latest close, Nike shares stood at $100.82, while their press time price was $94.30 highlighting the extended hours decline.
Buy stocks now with eToro – trusted and advanced investment platform
Disclaimer: The content on this site should not be considered investment advice. Investing is speculative. When investing, your capital is at risk.