
Although the cryptocurrency sector seems to be sailing on tranquil seas at the moment, certain indicators suggest it could just be the calm before the storm, at least for its largest asset, Bitcoin (BTC).
Indeed, Bitcoin’s volatility index has dropped below 25 which, historically, meant “a guaranteed recipe for massive volatility,” crypto trading expert and analyst Michaël van de Poppe said in his tweet on October 10.
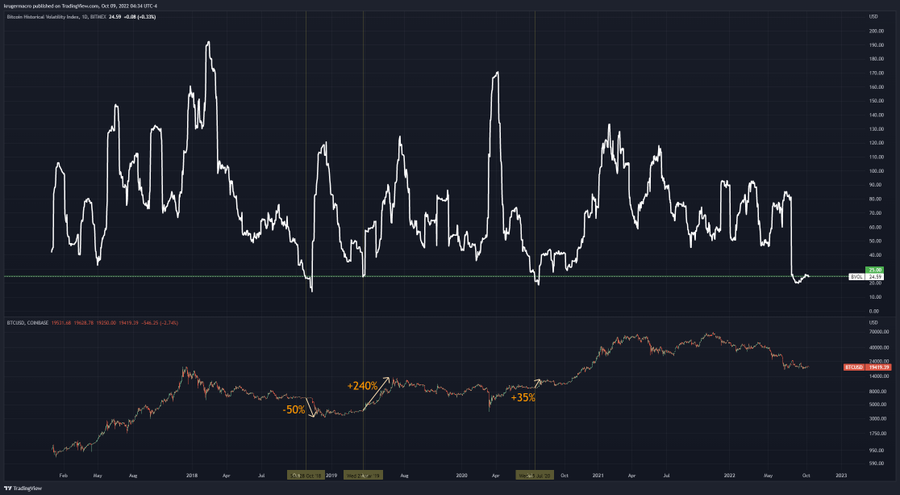
Van de Poppe noted three historical scenarios that could foretell this massive volatility by comparing Bitcoin’s volatility and price charts. The first one was a crash to $3,000 in 2018, followed by a break above $4,000 to $14,000 in 2019, as well as a “break above $10K in 2020 (kickstart bull 2021)” or “twice up, once down (Nov 2018),” as Alex Krüger, who first noticed the pattern, said.
Picks for you
In another tweet, Van de Poppe stressed that he was also “expecting serious volatility to jump in with CPI and PPI,” referring to the Consumer Price Index and the Producer Price Index reports for September that are due to come out this week.
What sort of volatility awaits?
Considering the historical behavior pattern of Bitcoin, this volatility could either go up or down. As another crypto analyst Ali Martinez noted, “Bitcoin losing the $19,000 support level can spell trouble.”
Earlier, Martinez dubbed this level as “the most significant support level (…) where 1.3 million addresses bought over 680,000 BTC. BTC needs to hold above this demand zone as IntoTheBlock IOMAP shows little to no support below it.”
It is also worth noting that recent data indicated that Bitcoin’s volatility had appeared to cool down compared to traditional stocks – the Dow Jones index – as both asset classes continued to battle unfavorable macroeconomic factors like high inflation and interest rates, as Finbold reported.
Bitcoin price analysis
Meanwhile, Bitcoin was at press time trading at $19,265, down 0.74% on the day, but up 0.39% across the previous seven days.
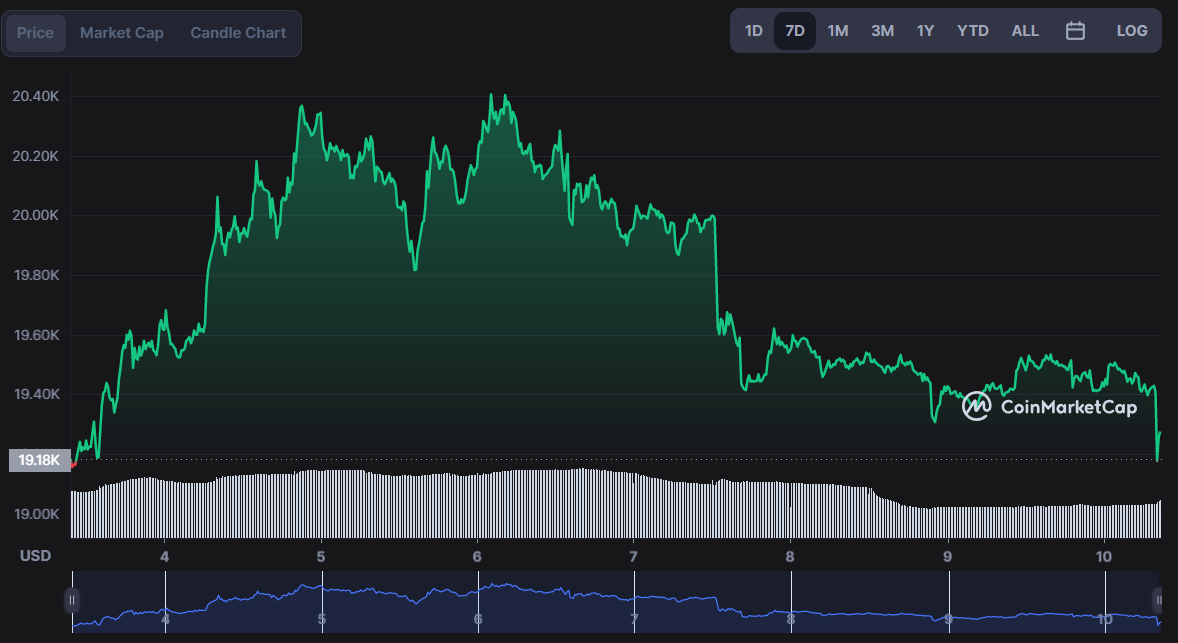
As things stand, the market cap of the largest digital asset by this indicator currently stands at $372.54 billion, according to CoinMarketCap data.
Disclaimer: The content on this site should not be considered investment advice. Investing is speculative. When investing, your capital is at risk.