
Ethereum (ETH) has been trading in the red for the past week, although a potential bullish turn could be waiting in the near future, signaled by the recent drop in the ratio of ETH coins mined each day versus its burn rate.
Specifically, Ethereum’s seven-day average net issuance has been around 2.21%, after topping with 3.48% on March 12, according to the chart shared by crypto analytics platform IntoTheBlock on April 7.
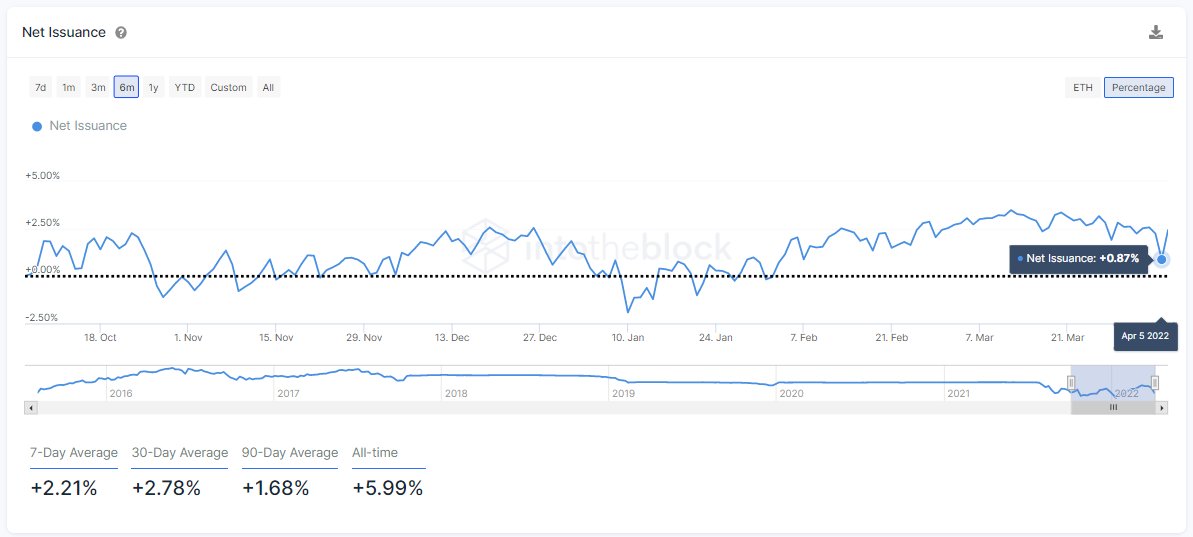
A low daily net issuance of Ethereum, or the decreasing difference between its daily mine and burn rate, means its supply is becoming limited. As a result, the diminished supply of the asset grows its demand, and increased demand typically drives the price up.
This is exactly what happened in the week of January 10 when Ethereum recorded a consistent negative net issuance. In response, its price soared by as much as 10%. Despite the market weakness later pushing it down, its week-long upward streak was noticeable.
Although ETH hasn’t had a negative net issuance day since then, it did reach a two-month low of 0.87% on April 5, indicating a possible price increase. Should this ratio fall below 0, Ethereum would move into deflation.
Other indicators of Ethereum price increase
Despite its recent bearish movements, Ethereum is still trading 24.21% higher than the month before, CoinMarketCap data shows.
As Finbold reported in late March, Ethereum has been witnessing some massive outflows from various crypto exchanges, decreasing the available supply of the token and driving up the demand.
Besides that, the network is experiencing increased demand due to the widely anticipated ‘The Merge’ – a network upgrade that will officially mark Ethereum’s transition from the Proof-of-Work (PoW) to the Proof-of-Stake (PoS) consensus.
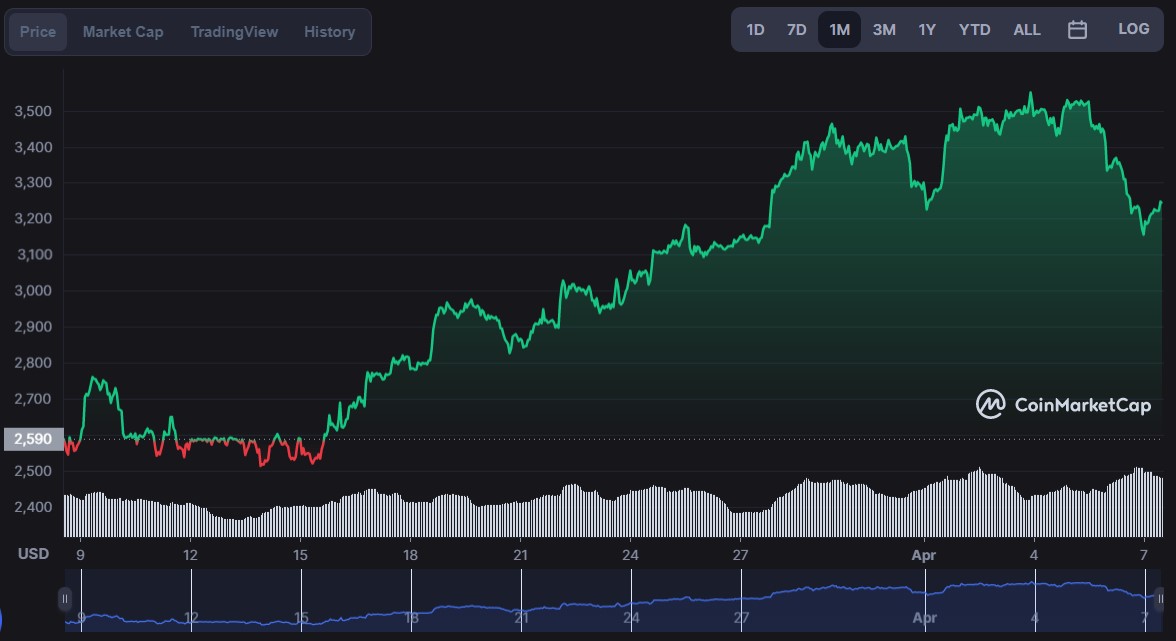
At press time, the price of Ethereum stood at $3,227, down 1.30% over 24 hours and 4.88% across the previous seven days. The market capitalization of the second-largest crypto asset by this indicator currently stands at $387.86 billion.
Disclaimer: The content on this site should not be considered investment advice. Investing is speculative. When investing, your capital is at risk.