Skip to content

Sign Up

or

By submitting my information, I agree to the Privacy Policy and Terms of Service.

Already have an account?

Ethereum open interest surges 80% since April, hitting 3-month high

Ethereum open interest surges 80% since April, hitting 3-month high

Summary

⚈ Ethereum open interest surged 80% since April, hitting a three-month high.

⚈ ETH price climbed 76%, aligning with increased speculative activity and open positions.

⚈ Technical analysis suggests a breakout toward $2,739 if bullish momentum continues.

Ethereum’s (ETH) open interest, a measure of open derivatives positions at any given time, reached a 3-month high on May 13, signalling strong confidence that the present rally will continue.

The total amount of derivatives positions open on the day was 17.05 billion, the highest it has been since February 2, and worth a total of roughly $32.68 billion, per data Finbold retrieved from cryptocurrency analysis platform CryptoQuant. The elevated level of ETH open interest is a clear sign of increased speculative trading —  and since Ethereum prices have been surging as of late, traders seem to be betting that the rally will continue.

Ethereum open interest year-to-date (YTD) chart. Source: CryptoQuant

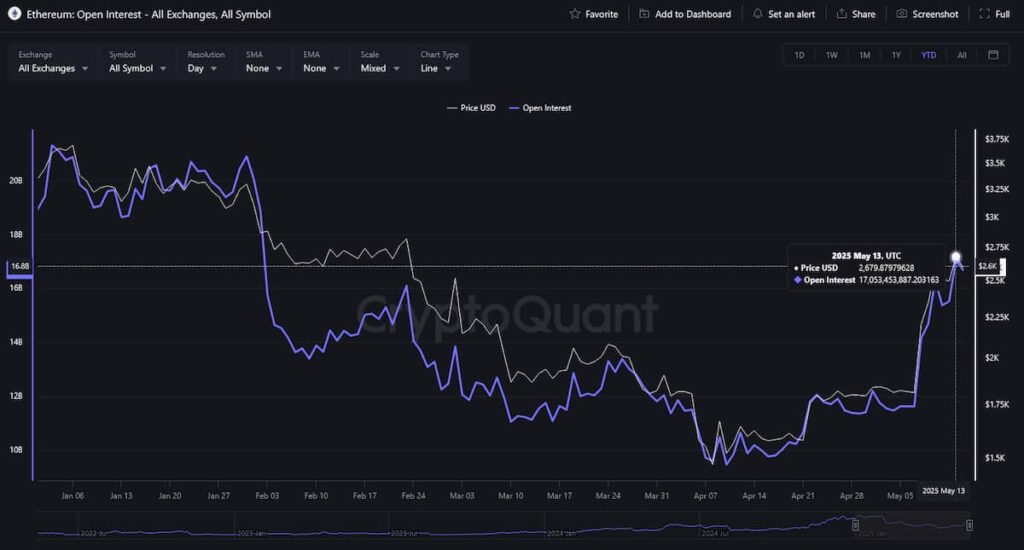
While speculative trading would still have to ramp up significantly to surpass a year-to-date (YTD) high of 21.3 billion reached in early January, the recent high represents an 80.47% surge from the YTD low of just 9.49 billion, seen on April 10.

The Ethereum open interest surge is just the latest in a long line of bullish ETH signals

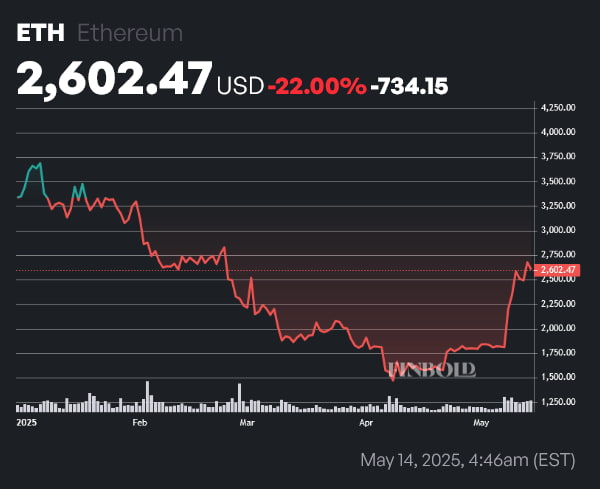
Over the same period, ETH price jumped 76.13% from $1,521 on April 10 to $2,679, indicating strong alignment between open interest and bullish price action.

Despite the latest move to the upside, ETH, which is trading at $2,602 as of press time on May 14, remains down 22% on a year-to-date basis.

ETH price year-to-date (YTD) chart. Source: Finbold

However, recent developments suggest that ETH’s longstanding slump could have come to an end. In spite of significant inflows, the rally has yet to produce significant bearish pressure.

Finally, on the technical analysis side of things, veteran trader Peter Brandt recently highlighted a congestion pattern that he believes could herald a ‘moon shot’ for ETH. Ethereum’s next zone of resistance lies at approximately $2,739 — and if market-wide dynamics remain favorable, a test of that level could occur in the very near term.

Featured image via Shutterstock

Best Crypto Exchange for Intermediate Traders and Investors

  • Invest in cryptocurrencies and 3,000+ other assets including stocks and precious metals.

  • 0% commission on stocks - buy in bulk or just a fraction from as little as $10. Other fees apply. For more information, visit etoro.com/trading/fees.

  • Copy top-performing traders in real time, automatically.

  • eToro USA is registered with FINRA for securities trading.

30+ million Users worldwide
Securities trading offered by eToro USA Securities, Inc. (“the BD”), member of FINRA and SIPC. Cryptocurrency offered by eToro USA LLC (“the MSB”) (NMLS: 1769299) and is not FDIC or SIPC insured. Investing involves risk, and content is provided for educational purposes only, does not imply a recommendation, and is not a guarantee of future performance. Finbold.com is not an affiliate and may be compensated if you access certain products or services offered by the MSB and/or the BD

Latest posts

Finance Digest

By subscribing you agree with Finbold T&C’s & Privacy Policy

Related posts

Services

IMPORTANT NOTICE

Finbold is a news and information website. This Site may contain sponsored content, advertisements, and third-party materials, for which Finbold expressly disclaims any liability.

RISK WARNING: Cryptocurrencies are high-risk investments and you should not expect to be protected if something goes wrong. Don’t invest unless you’re prepared to lose all the money you invest. (Click here to learn more about cryptocurrency risks.)

By accessing this Site, you acknowledge that you understand these risks and that Finbold bears no responsibility for any losses, damages, or consequences resulting from your use of the Site or reliance on its content. Click here to learn more.