
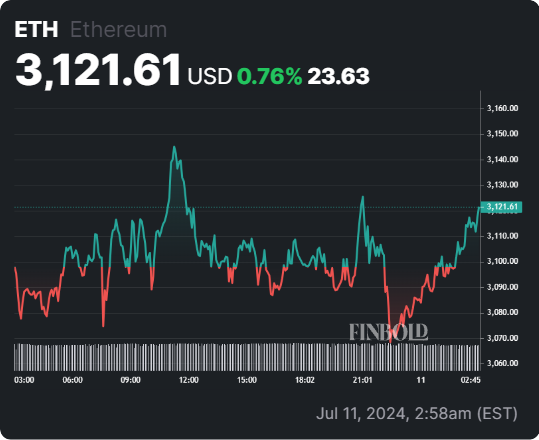
After threading above the $3,000 mark for most of 2024 and even surpassing $4,000 briefly in March amid a broader cryptocurrency market surge, Ethereum (ETH) has been hit by the recent drawback as its price fell below $3,000 briefly on July 8.
Despite this, ETH remains in the green so far in 2024, as it added 32.34% to its value on a year-to-date (YTD) basis.
As of July 11, the previous 24 hours have brought gains of 0.75%, which helped reverse the damaging 1.86% loss during the last week.
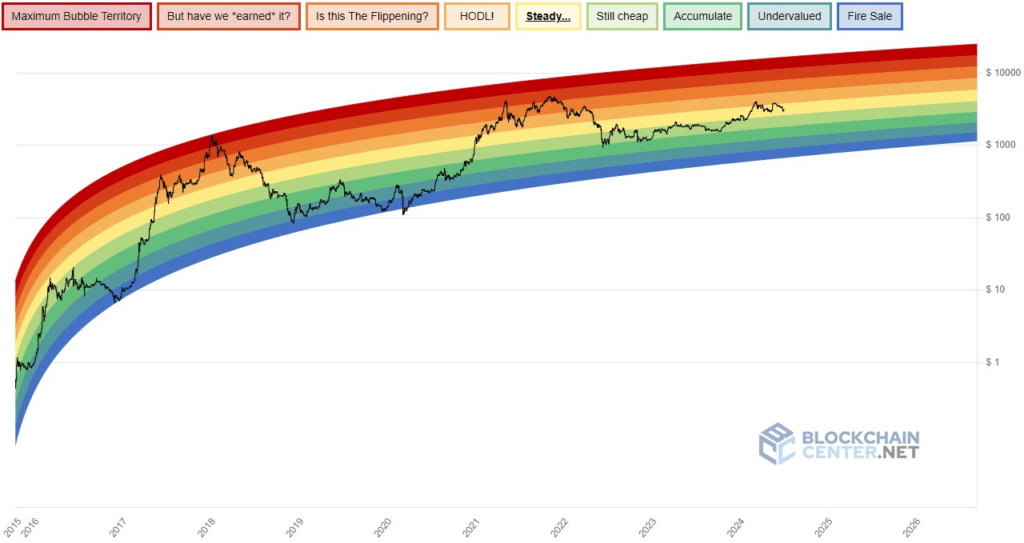
Amid the current atmosphere of fear and unpredictability, the Ethereum Rainbow Chart, which employs a logarithmic growth curve to reflect investor sentiment across different price points, can provide essential insights into Ethereum’s potential future movements in the crypto market.
The 2024 Ethereum Rainbow chart
The Ethereum Rainbow Chart consists of nine distinct color-coded zones, each symbolizing a specific price range and the corresponding market sentiment. These zones range from “Fire Sale,” indicating extreme bearish sentiment at the lowest prices, to “Maximum Bubble Territory,” suggesting that the cryptocurrency’s price has soared to unsustainable levels and is likely to drop.
Currently, ETH is in the “Steady” zone, which can best be described as a neutral zone where neither buying nor selling pressure dominates the sentiment. Traders’ best move is to wait and see in which direction the price moves on the chart.

Ethereum Rainbow chart predicts its price for end of 2024
The Rainbow Chart illustrates Ethereum’s historical performance within the context of market sentiment and provides some foresight into the potential future prices of the world’s second-largest cryptocurrency.
If ETH drops below $1,037.78 by late December, the current bull market is ending and a crypto winter is approaching. Conversely, trading above $8,930.22 would indicate that Ethereum is entering bubble territory, with consistent closes above $12,791.09 almost confirming an impending major correction.
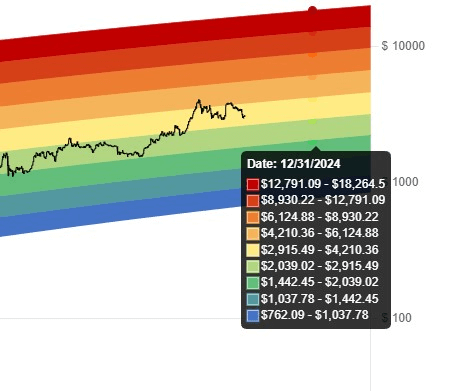
The Rainbow Chart also shows that ETH would be most stable at the end of 2024 if it remains within the $2,915.49 to $4,210.36 range, known as the ‘HODL’ zone. It would still be relatively stable between $4,210.36 and $6,124.88, the ‘Is this the Flippening?’ range, though investors should remain cautious.
Additionally, the tool suggests that late 2024 would be a good time to buy Ethereum if it trades between $1,442.45 and $2,039.02, labeled as the ‘Accumulate’ zone. Prices up to $2,915.49 are also considered relatively inexpensive.
Disclaimer: The content on this site should not be considered investment advice. Investing is speculative. When investing, your capital is at risk.