Skip to content

To keep going please Log in.

or

By submitting my information, I agree to the Privacy Policy and Terms of Service.

To keep going please Log in.

or

By submitting my information, I agree to the Privacy Policy and Terms of Service.

To keep going please Log in.

or

By submitting my information, I agree to the Privacy Policy and Terms of Service.

To keep going please Log in.

or

By submitting my information, I agree to the Privacy Policy and Terms of Service.

​​Ethereum Rainbow Chart predicts ETH price for February 1, 2026

​​Ethereum Rainbow Chart predicts ETH price for February 1, 2026
Paul L.

The Ethereum (ETH) Rainbow Chart is predicting that the second-ranked cryptocurrency by market cap is likely to remain within its long-term valuation corridor by February 1, 2026, pointing to moderate upside rather than an extreme move.

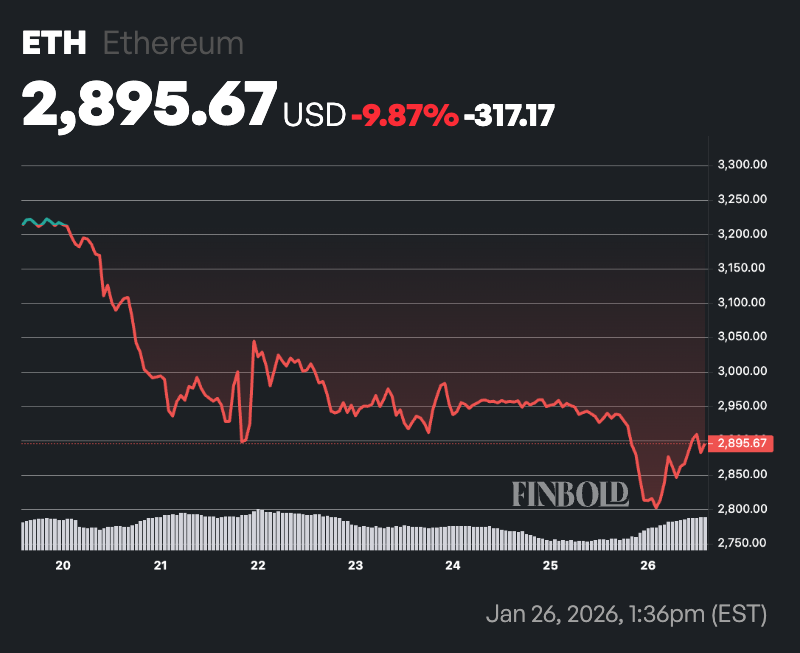
With Ethereum trading around $2,895 at press time, the chart suggests a likely price range clustered near the lower-to-mid valuation bands in the near term.

ETH seven-day price chart. Source: Finbold

ETH price prediction

For February 1, 2026, the Rainbow Chart’s lowest band, labeled ‘Fire Sale’, spans roughly $994.14 to $1,340.56 and reflects periods of extreme pessimism when Ethereum has historically traded well below its long-term trend. Above it, the ‘Undervalued’ band ranges from about $1,340.56 to $1,843.11, signaling prices that remain discounted despite improving sentiment.

Ethereum rainbow price chart. Source: BlockchainCenter

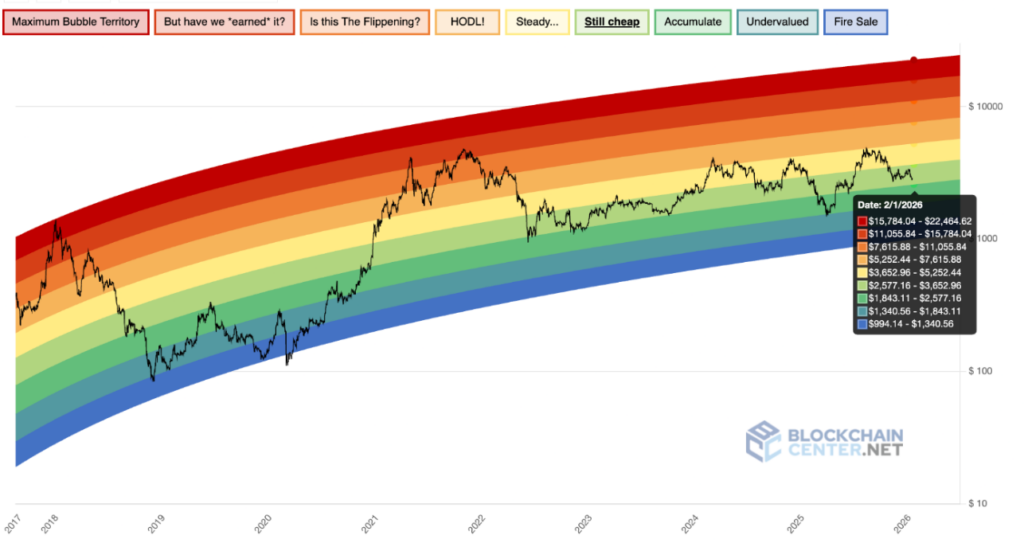
The ‘Accumulate’ band extends from approximately $1,843.11 to $2,577.16 and represents levels where long-term investors have historically built positions as downside risk diminishes. 

Just above it, the ‘Still Cheap’ band spans roughly $2,577.16 to $3,652.96. With ETH at $2,895 in late January, price action currently sits within this band, suggesting Ethereum is inexpensive relative to its long-term growth curve but no longer deeply undervalued.

The next zone, the ‘Steady’ band, ranges from about $3,652.96 to $5,252.44 and reflects balanced market conditions where price closely tracks the long-term trend and speculative excess is limited. A gradual move into this band by February 1 would imply ETH trading in the low-to-mid $3,000 range, consistent with the chart’s trajectory if momentum remains stable.

ETH extreme price level outlook 

Above fair value, the ‘HODL’ band spans roughly $5,252.44 to $7,615.88 and signals rising optimism and stronger bullish momentum. 

Higher still, the ‘Is This the Flippening?’ band ranges from about $7,615.88 to $11,055.84, reflecting heightened enthusiasm and increasingly stretched valuations. The ‘But Have We Earned It?’ band follows, spanning approximately $11,055.84 to $15,784.04, a zone historically associated with late-cycle optimism.

At the top of the spectrum, ‘Maximum Bubble Territory’ ranges from roughly $15,784.04 to $22,464.62 and represents extreme euphoria, where prices have historically proven unsustainable.

It’s worth noting that the Ethereum Rainbow Chart plots ETH’s price on a logarithmic scale and fits it to an expanding long-term growth curve divided into colored bands reflecting adoption cycles, volatility, and diminishing returns. It does not predict exact prices but shows where Ethereum sits relative to its historical trend.

Featured image via Shutterstock


Best Crypto Exchange for Intermediate Traders and Investors

  • Invest in cryptocurrencies and 3,000+ other assets including stocks and precious metals.

  • 0% commission on stocks - buy in bulk or just a fraction from as little as $10. Other fees apply. For more information, visit etoro.com/trading/fees.

  • Copy top-performing traders in real time, automatically.

  • eToro USA is registered with FINRA for securities trading.

30+ million Users worldwide
Securities trading offered by eToro USA Securities, Inc. (“the BD”), member of FINRA and SIPC. Cryptocurrency offered by eToro USA LLC (“the MSB”) (NMLS: 1769299) and is not FDIC or SIPC insured. Investing involves risk, and content is provided for educational purposes only, does not imply a recommendation, and is not a guarantee of future performance. Finbold.com is not an affiliate and may be compensated if you access certain products or services offered by the MSB and/or the BD
Finbold Career

Join Finbold's newsroom, become a crypto reporter today!

Apply now to join Finbold as a crypto/finance news writer!

Latest posts

Finance Digest

By subscribing you agree with Finbold T&C’s & Privacy Policy

Related posts

Finbold AI Agent

How AI Price Predictions Work

We use cutting-edge AI models to forecast future prices for stocks and crypto.

Home

IMPORTANT NOTICE

Finbold is a news and information website. This Site may contain sponsored content, advertisements, and third-party materials, for which Finbold expressly disclaims any liability.

RISK WARNING: Cryptocurrencies are high-risk investments and you should not expect to be protected if something goes wrong. Don’t invest unless you’re prepared to lose all the money you invest. (Click here to learn more about cryptocurrency risks.)

By accessing this Site, you acknowledge that you understand these risks and that Finbold bears no responsibility for any losses, damages, or consequences resulting from your use of the Site or reliance on its content. Click here to learn more.