
After the Shanghai and Capella upgrades, jointly called Shapella, enabled Ethereum (ETH) unstaking for the first time since ETH staking was introduced in December 2020, its price surpassed the $2,000 psychological threshold and remained stable, leaving investors to try and gauge its future movements.
In doing so, some cryptocurrency traders use BlockchainCenter’s rainbow price chart for Ethereum to follow the digital asset’s historical movements in relation to various moving averages (MA), which may help in recognizing certain trends and allow people to make investing decisions.
Currently, the rainbow chart suggests that Ethereum is in the ‘Fire Sale’ phase, which is indicated by the purple color and ranges between $0 and $2,320, as it is trying to break upwards into the ‘Undervalued’ zone (blue), which stands between $2,320 and $3,282, according to the data retrieved by Finbold on April 18.
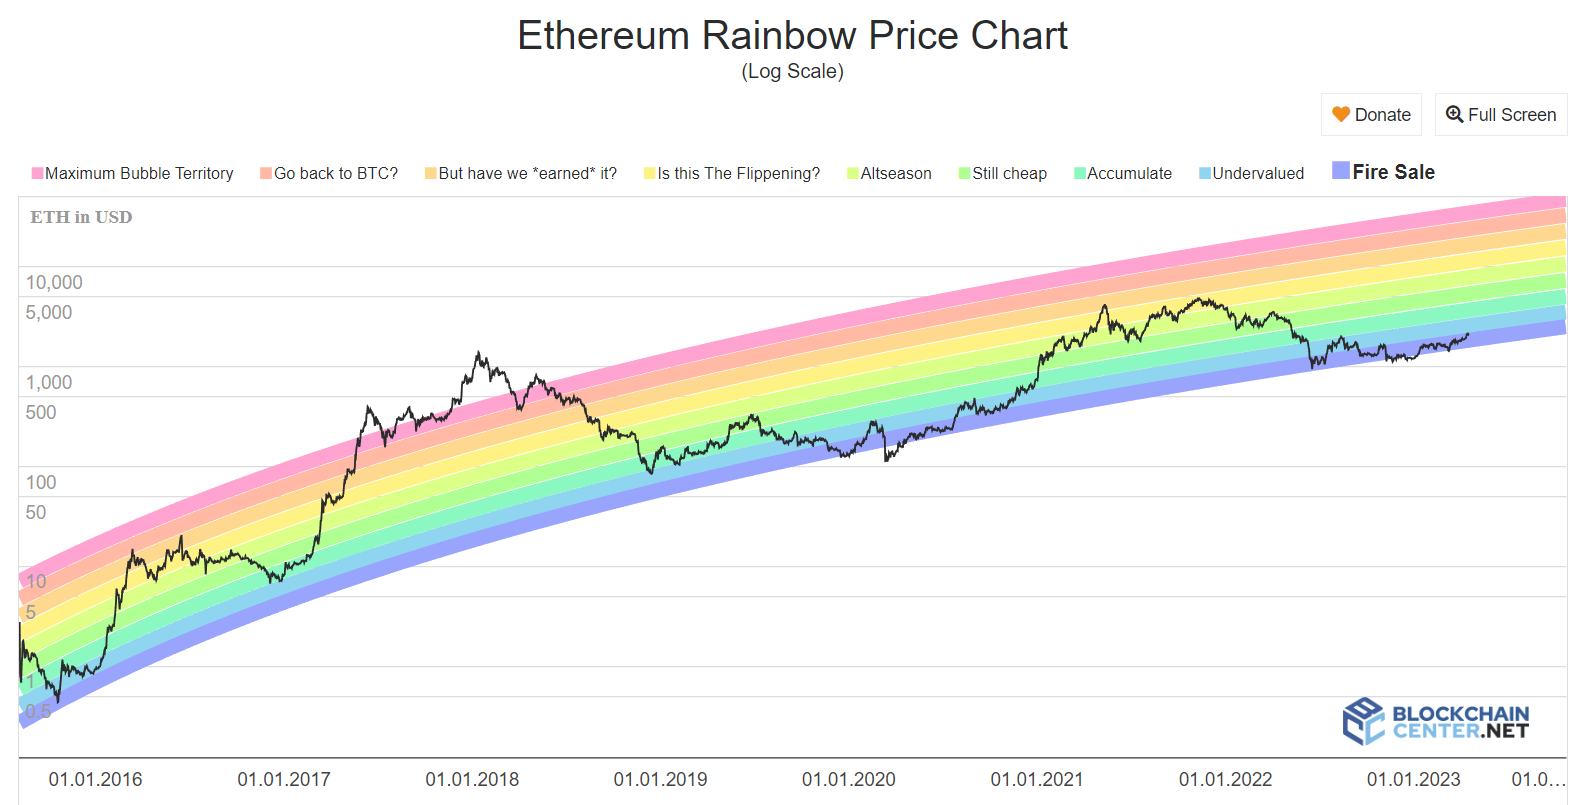
As opposed to the Bitcoin (BTC) rainbow chart, which suggests trends up to 2035, Ethereum’s (for now) only allows users to observe possible trends for the next several months – until October 2023 – but one can still make educated guesses based on its earlier chart patterns.
End-of-year projections
Specifically, Ethereum was last in the ‘Fire Sale’ zone in July 2020, from which it took almost a year (until May 2021) to peak in the ‘But have we *earned* it’ zone at $4,354. Today, this zone for ETH ranges between $14,625 and $21,231, and it may not happen until February 2024 if the chart patterns repeat themselves.
Before that, Ethereum was in the ‘Fire Sale’ area only once – in October 2015, soaring to the ‘Go back to BTC?’ zone four months later. That said, this bullish rally was followed by a drop toward the ‘Undervalued’ area, which it reached in January 2017. However, ETH crossed the barrier for ‘Maximum Bubble Territory’ in May 2017, staying there interchangeably with the ‘Go Back to BTC?’ until August 2018.
If this pattern is to happen again, it would mean that Ethereum could soar to the ‘Go back to BTC?’ in August 2023 (currently between $21,231 and $30,654), then drop to the ‘Undervalued’ in September 2024 (currently between $2,320 and $3,282), before skyrocketing in January 2025 in the ‘Maximum Bubble Territory’ ( $30,654 and beyond).
Ethereum price analysis
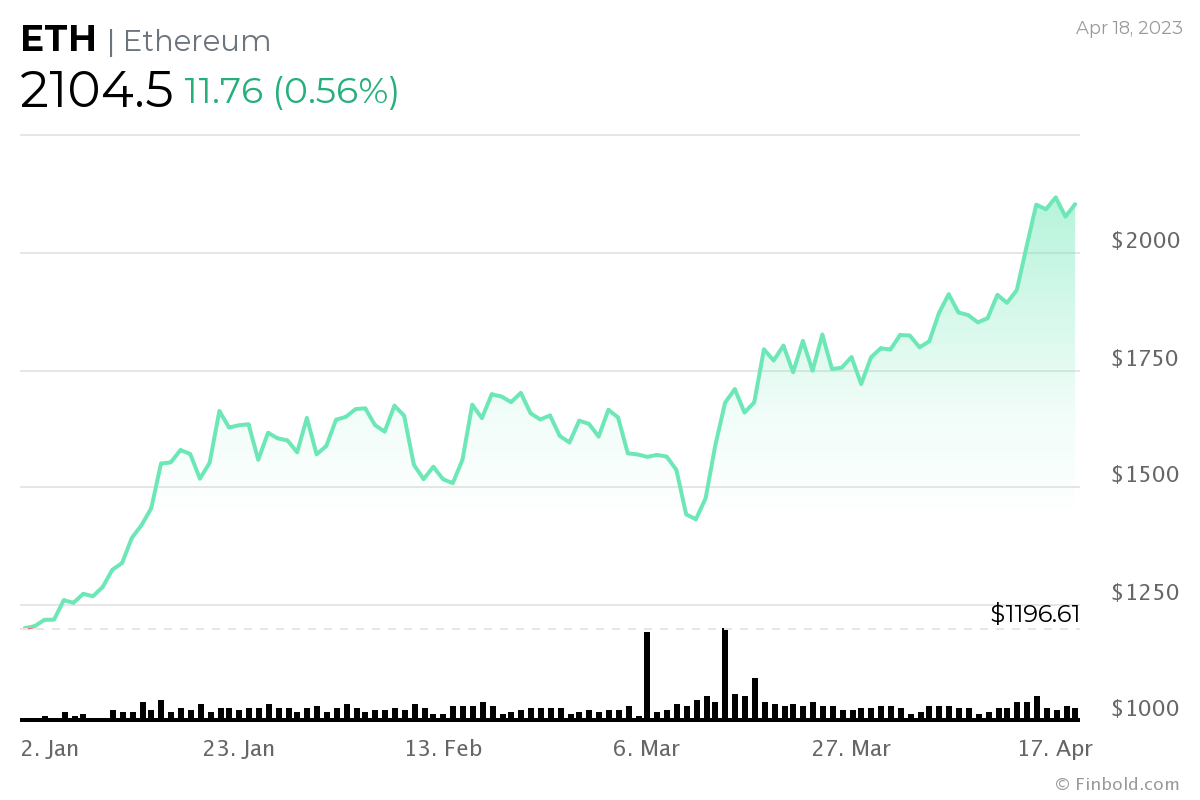
As things stand, Ethereum is currently changing hands at the price of $2,104.50, which demonstrates an increase of 0.56% on the day, adding up to the positive weekly change of 10.19% and an 18.94% gain in the last month, as the asset is holding on to the nearly 80% increase it achieved since the year’s turn.
All things considered, the most bullish rainbow chart scenario for Ethereum sees it surpassing $21,231 in August. On the other hand, $14,625 is possible, but not before February 2024. However, it is important to keep in mind that the situation in the crypto sector can change quickly and depends on more outside factors than just chart patterns.
Disclaimer: The content on this site should not be considered investment advice. Investing is speculative. When investing, your capital is at risk.