
Aligned with the optimistic atmosphere in the cryptocurrency sector, Ethereum (ETH) has recorded a bullish rally which has slowed down in recent weeks, but a chart pattern formed not long ago suggests more bullishness is in store for the second-largest cryptocurrency by market capitalization.
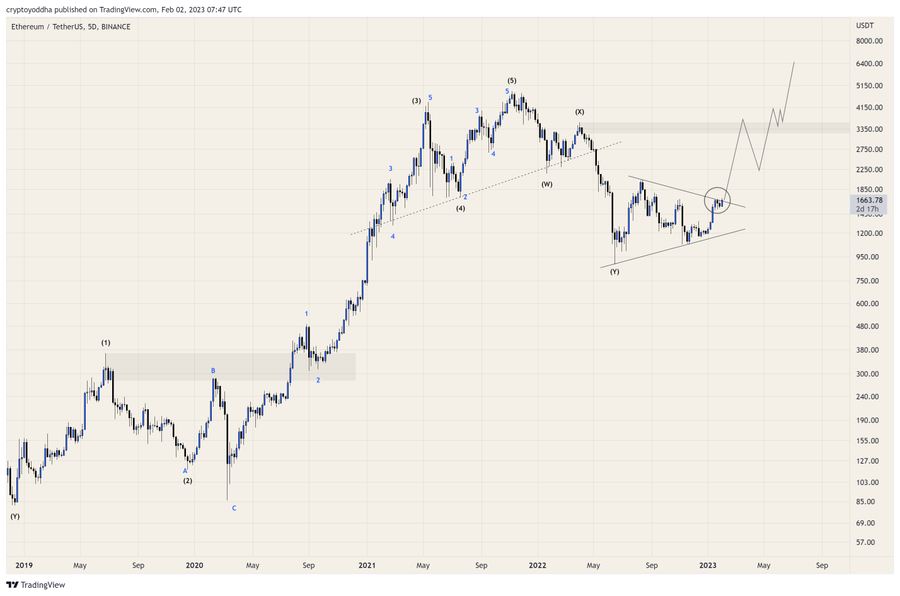
Indeed, Ethereum has made a successful breakout from the symmetrical triangle or ‘pennant,’ opening the way for the price of ETH to potentially reach $3,500 in the near future, as observed by the pseudonymous crypto analyst Crypto Yoddha in a tweet from February 2.
What does this mean?
Specifically, this pattern occurs when the price of an asset consolidates in a way that generates two converging trendlines with roughly equal slopes. As the price moves toward the apex, it is set to either breach the upper trendline for a breakout or the lower trendline for a breakdown.
Breaking out of the pattern indicates an uptrend and rising prices, whereas breaking down suggests a downtrend and falling prices. As Ethereum recently broke out on the upper side of this symmetrical triangle, its further advance cannot be ruled out.
That said, the predictions of a panel of 56 industry specialists, which gathered in late January, are somewhat less bullish, estimating that Ethereum would be worth $2,184 by the end of 2023, which is lower than the above projection for the near future.
Bullish factors for Ethereum
The predicted ETH rally in the future could be partially attributed to the developments on the Ethereum blockchain, such as the testnet for its staking feature, which was launched on February 1, in anticipation of the Shanghai and Capella upgrades set for February 7.
As a reminder, Ethereum developers have been working on the Shanghai hard fork, which is projected to launch fully in March, marking the first major network upgrade since the Merge, which officially marked its transition to the Proof-of-Stake (PoS) protocol.
On top of that, Ethereum’s on-chain activity has increased, and the network has been adding an average of 130,000 new unique addresses per day since the year’s turn, reaching an all-time high (ATH) of 221 million, as Finbold reported on January 30.
Ethereum price analysis
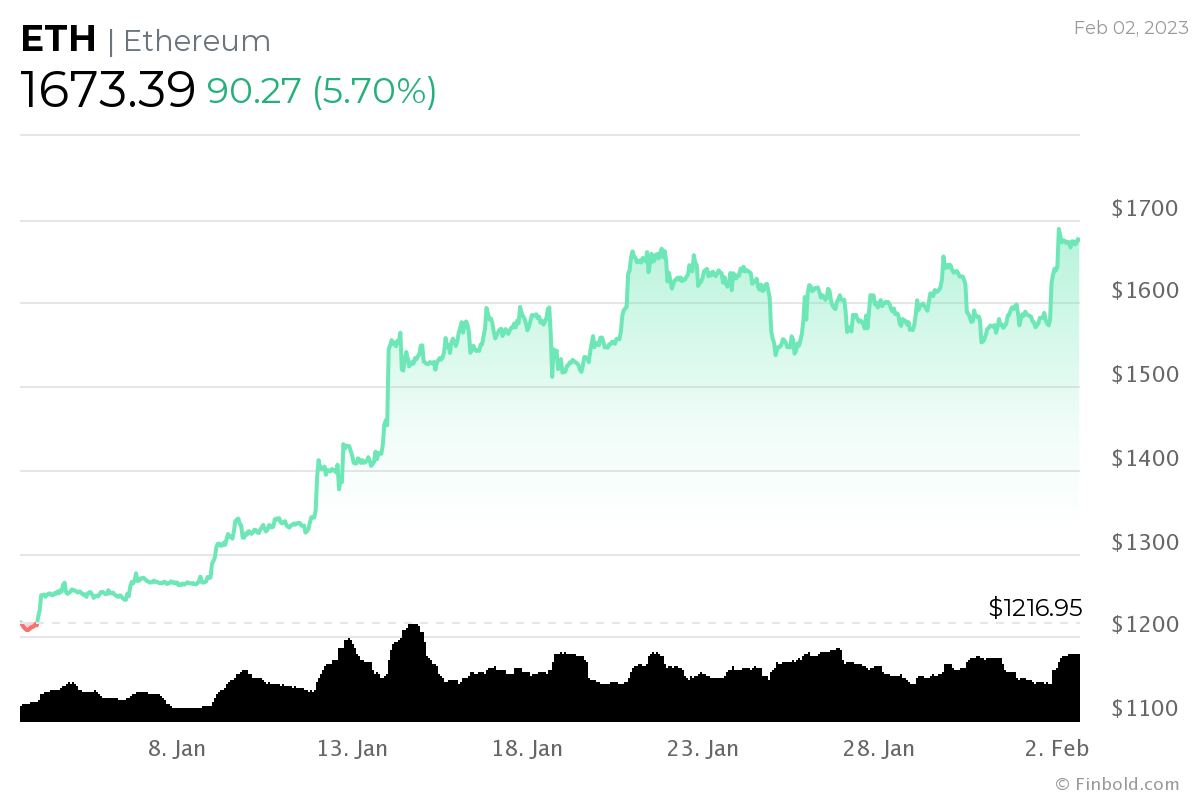
Meanwhile, Ethereum was at press time changing hands at the price of $1,673, which demonstrates an increase of 5.7% in the last 24 hours as well as 3.64% compared to the seven days before, adding up to the aggregated gain of 34.62% during the previous 30 days.
According to the machine learning algorithms retrieved from the cryptocurrency tracking platform PricePredictions on February 1, Ethereum was projected to trade at the price of $1,555 on February 28. That said, this projection has since increased to $1,693.
Disclaimer: The content on this site should not be considered investment advice. Investing is speculative. When investing, your capital is at risk.