
The S&P 500 could decline to 6,800 ahead of the 2026 U.S. midterm elections, according to a new technical analysis that points to a potential breakdown from the index’s long-term bullish trend channel.
The forecast comes after the benchmark index triggered a bearish signal in early September, with analysts noting that the S&P 500 had entered a new downward leg within a one-month channel down pattern.
The projection suggests a retreat of roughly 10% from current levels near 7,600.
The bearish outlook by TradingShot in a TradingView post on September 15 follows the index’s recent pullback toward its 50-day moving average (MA), a level that has already been tested.
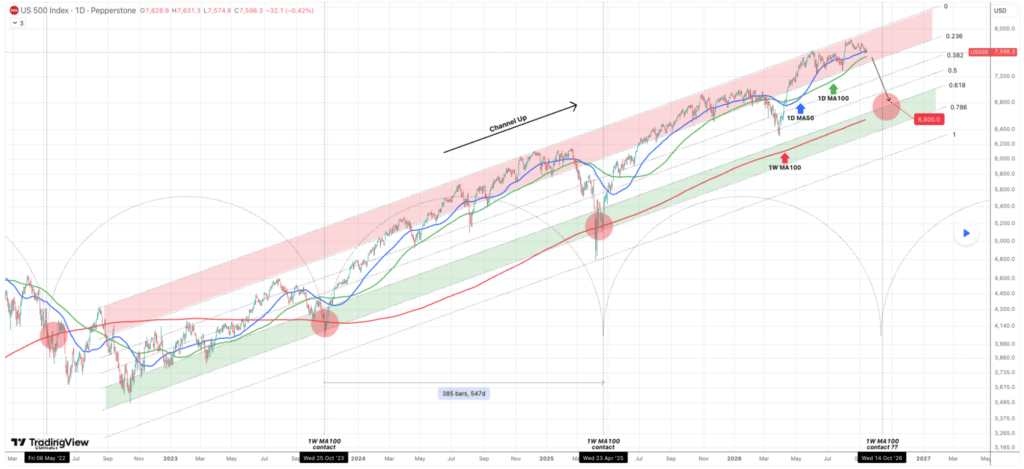
Attention is now shifting to the 100-day moving average, which has served as key support since the S&P 500’s April breakout and helped contain the July 31 pullback.
According to the analysis, a decisive break below this level could open the door to the next major support zone near the 100-week moving average. This area also coincides with the 0.618-0.786 Fibonacci retracement range of the index’s four-year ascending channel, making it a critical technical level.
The outlook further highlighted a recurring pattern since May 2022, with the S&P 500 experiencing a significant correction roughly every 385 days before finding support at its 100-week moving average and resuming its broader uptrend.
Based on this pattern, TradingShot expects the S&P 500 to revisit the 6,800 region as the market approaches the 2026 midterm elections.
The forecast comes as investors assess the historical relationship between U.S. midterm elections and stock market performance.
S&P 500 seasonality trends
Market data shows that election years often bring heightened volatility as investors react to uncertainty surrounding fiscal policy, taxation, regulation, and congressional control.
However, historical studies have also found that markets frequently stabilize once election outcomes become clear.
The bearish outlook comes as the S&P 500 trades less than 3% below its August record high, supported by strong corporate earnings and continued demand for artificial intelligence-related stocks.
Investors are increasingly concerned about rising Treasury yields, elevated oil prices, and persistent inflation. The 10-year Treasury yield recently climbed above 5%, while Brent crude rose above $100 a barrel, fueling expectations that the Federal Reserve may keep interest rates higher for longer.
These pressures have already weighed on equities, with the S&P 500 pulling back from its August peak as investors reassess valuations in a higher-rate environment.
Seasonal trends could add to the volatility considering that historically, September and October have been difficult months for stocks, particularly during midterm election years.
Since 1930, the S&P 500 has recorded a decline of at least 5% during the September-October period in 15 of the 24 midterm election cycles.
Featured image via Shutterstock.