
Summary
⚈ Bearish technical patterns are emerging, including a descending triangle and flattening moving averages.
⚈ Failure to break above $3,350 could trigger further downside, challenging prospects of a $4,000 high in 2025.
Gold’s gains above the $3,000 mark could likely be short-lived, as the precious metal’s momentum indicators suggest a pullback may be imminent.
While reclaiming the $3,500 resistance remains a key target, gold has entered its most overbought level on the monthly Relative Strength Index (RSI) since February 2008.
Gold’s RSI has surged to 84.63, well above the overbought threshold of 70, marking its highest level since early 2008, just months before the metal saw a steep correction amid the global financial crisis.
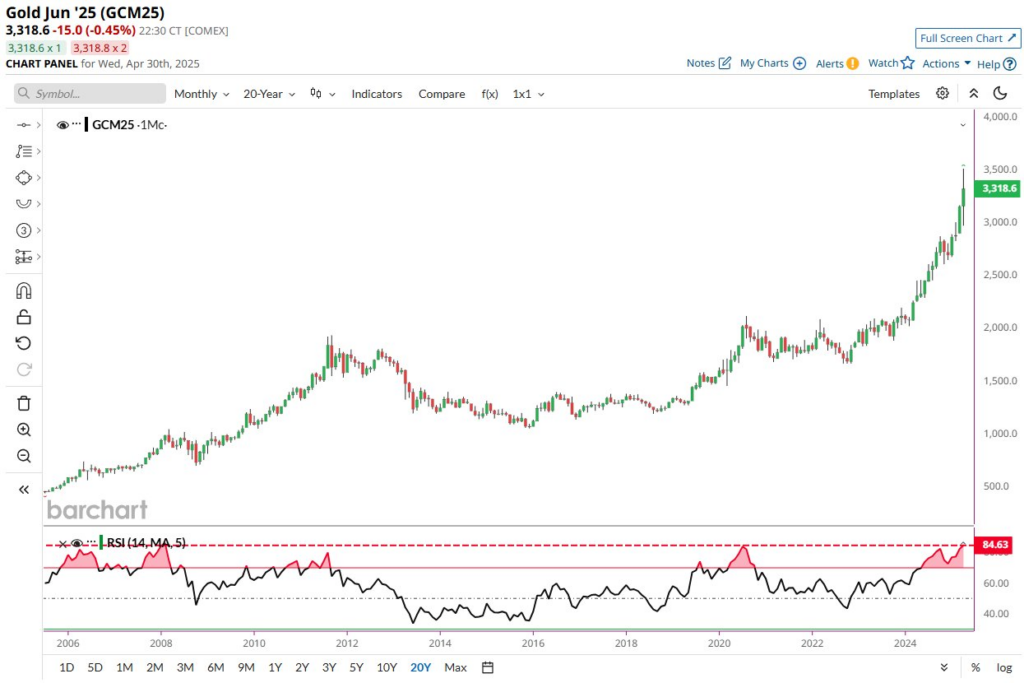
Notably, over the past two decades, similar spikes in the monthly RSI have often marked medium- to long-term tops in the gold market.
Gold’s recent momentum has been driven by investors shifting toward safe-haven assets amid broad market volatility fueled by uncertainty around trade tariffs.
This climate has contributed to growing warnings from market participants about a possible impending recession.
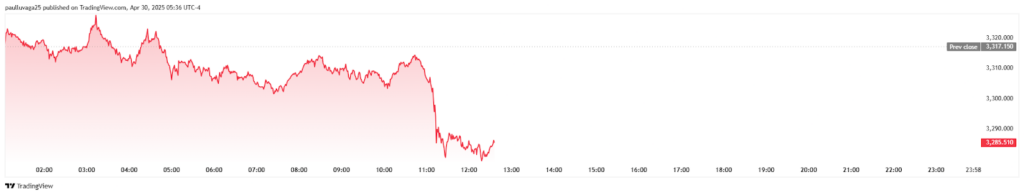
Already, gold is showing weakness, down 1% at press time to a valuation of $3,283, though it remains up 25% year to date.
The current price sits above both the 50-day simple moving average (SMA) of $3,127 and the 200-day SMA of $2,828, indicating a sustained bullish trend.
Gold forms bearish pattern
Meanwhile, veteran trader Peter Brandt has suggested that the yellow metal may be headed for further losses.
In an X post on April 29, Brandt noted that gold is forming a coiling pattern within a descending triangle, with lower highs being created against horizontal support near the $3,300 level.
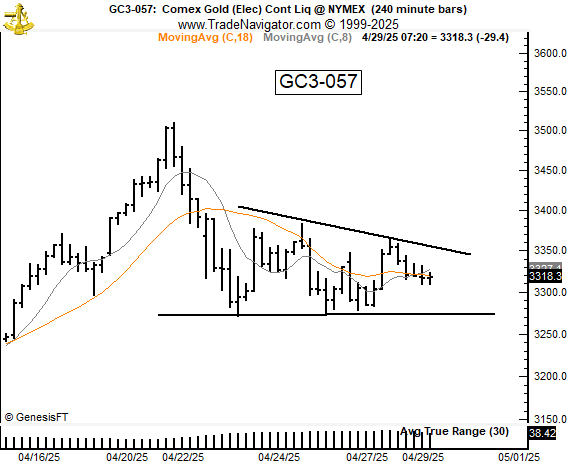
He indicated that gold appears to be forming a continuation descending triangle, a bearish pattern that often signals further declines.
Brandt also sees a strong resemblance to the 2013 weekly chart setup, which preceded a sharp breakdown and an extended bearish cycle. If this analog plays out, gold could breach current support by nearly $3,300 and target the $3,200 range or lower.
Flattening moving averages, with the short-term line below the longer-term, further supports the bearish case.
Unless bulls reclaim the downtrend and push above $3,350, the bias remains to the downside. Any sustained bearish sentiment could likely make it harder for gold to reach a $4,000 record high in 2025.
Featured image from Shutterstock