
A crypto trading expert has shared a compelling analysis of the interplay between Bitcoin (BTC) and gold, highlighting the role of the precious metal in determining the next crypto bull run.
In an X post on July 31, crypto analyst CryptoCon suggested that Bitcoin bull markets have historically commenced as gold bear markets begin.
Notably, Bitcoin’s bull run in 2013 started in the same period as the gold bear market of that year. A similar pattern emerged in 2017, with Bitcoin’s bull run coinciding with the gold bear market, and the trend continued in 2021, reinforcing the inverse relationship between Bitcoin’s ascendance and gold’s decline.
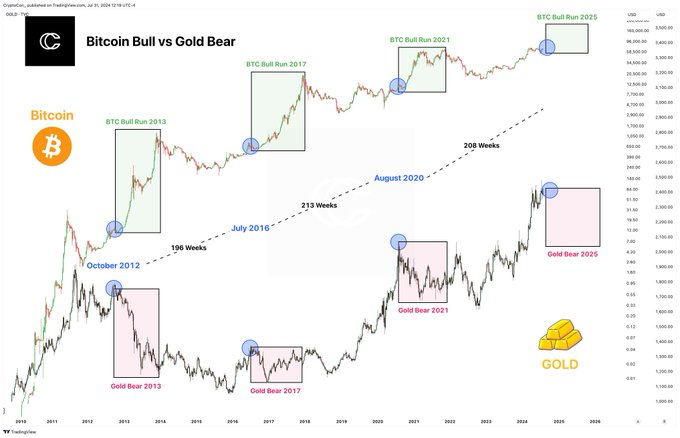
CryptoCon’s analysis indicated a pattern in timing these market shifts, noting durations from one gold bear market to the next significant market movement as 196 weeks and 213 weeks.
Bitcoin’s critical juncture
It has been 208 weeks since the last gold bear market pinnacle in August 2020. Given the past intervals, the market is approaching a critical juncture, suggesting a significant shift could be imminent.
Therefore, the expert review implies that the impending gold bear market could trigger the next Bitcoin bull run.
“The Bitcoin bull market starts where the Gold bear market begins. <…> Not much longer now for the big flip and Bitcoin bull run,” the expert stated.
Indeed, both assets have been compared over their ability to store wealth. Notably, Bitcoin proponents believe that crypto will likely replace the precious metal, earning the phrase ‘digital gold.’
At the moment, gold is witnessing bullish momentum, with the metal surging above $2,400. Notably, the metal jumped amid news of geopolitical tensions in the Middle East between Israel and Lebanon.
Bitcoin price analysis
On the other hand, Bitcoin is battling bearish sentiments in the short term after losing the $67,000 support. Notably, the maiden crypto failed to breach the $70,000 resistance, partly stemming from a drop in specific spot Bitcoin exchange-traded funds (ETF).
By press time, BTC was trading at $66,430, with daily gains of over 1%. Over the past week, Bitcoin has been down about 0.2%.
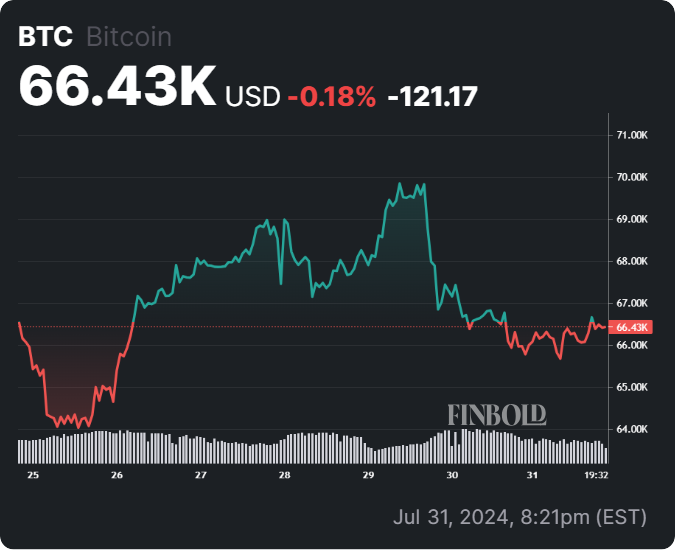
Bitcoin’s weekly chart shows significant fluctuations influenced by major news events. Starting at $66,680 on July 25, the price dropped due to Mt. Gox creditors receiving Bitcoin, creating market uncertainty.
However, it recovered and peaked above $69,000 by July 28, driven by positive news, including Senator Cynthia Lummis’s regulatory bill. The chart identifies critical support and resistance levels at $66,000 and $69,000, respectively.
Disclaimer: The content on this site should not be considered investment advice. Investing is speculative. When investing, your capital is at risk.