Nvidia’s (NASDAQ: NVDA) share price has exhibited extreme volatility in the last 48 hours, recording significant gains that have since been erased, a trend unfamiliar to the semiconductor giant.
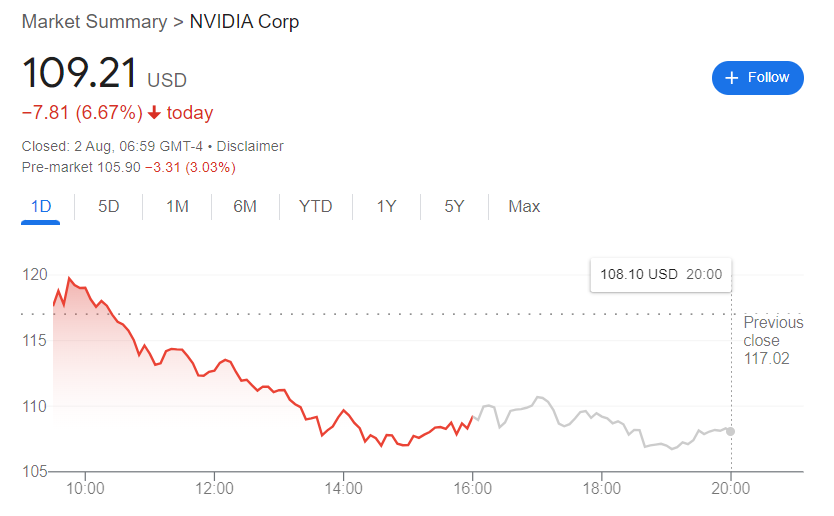
On the last day of July, the stock appeared primed to reclaim the $120 resistance zone, but the gains were erased the following day. By the close of markets on August 1, the tech giant was trading at $109.21, with 24-hour losses of almost 7%.
In this line, between July 31 and August 1, the stock experienced a $600 billion swing in its market capitalization, raising eyebrows across the financial community.
On July 31, the chipmaker shattered records by adding an unprecedented $330 billion to its market cap, marking the largest single-day market cap increase in history. However, the next trading day saw a significant reversal, with Nvidia’s market cap plunging by approximately $270 billion.
To put this into perspective, an analysis by financial markets commentary platform The Kobeissi Letter, in an X post on August 1, noted that this dramatic fluctuation, typically associated with high-risk, speculative “meme stocks,” has now befallen one of the world’s leading tech giants.
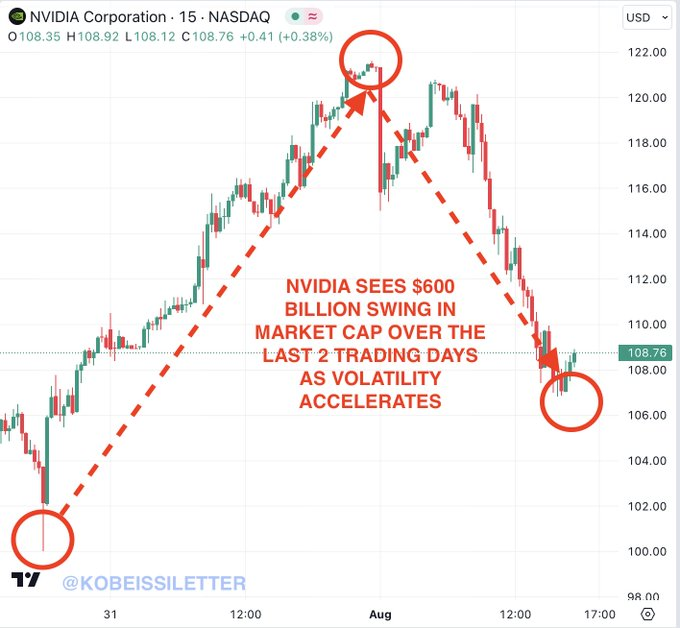
“That’s a $600 BILLION swing in market cap in just 2 trading days. The 3rd largest public company in the world is officially trading like a meme stock,” the platform noted.
Implication of Nvidia’s recent trading activity
It’s worth noting that meme stocks, known for their explosive price movements driven by social media hype and retail investor enthusiasm, exhibit high volatility and are subject to rapid, unpredictable changes in market sentiment. Nvidia’s recent price action mirrors this pattern, prompting comparisons.
At the same time, following these price fluctuations, the stock had initially earned comparisons to trading like a penny stock.
The tech giant had rallied after it emerged that Microsoft (NASDAQ: MSFT) plans to spend even more on Nvidia-based infrastructure in 2025, suggesting that the company was seeing a return on investment from its expensive GPU-based servers.
The capital movement within the stock paints a picture of extreme market behavior. Nvidia’s massive market cap increase in a single day was unprecedented. This kind of surge typically follows significant positive news or market speculation. The subsequent steep decline in market cap suggests a rapid sell-off or profit-taking by investors anticipating short-term gains.
Why Nvidia is down?
Overall, Nvidia’s stock is down primarily due to shifting investor sentiment driven by weak economic data. Despite starting August on a positive territory, concerns about valuation and a broader market rotation into small-cap stocks in preparation for a potential lower interest rate environment have contributed to the decline.
Additionally, the volatility is expected to continue, especially with the upcoming July employment report, which could further influence market movements. Until Nvidia’s second-quarter earnings report at the end of the month, investor sentiment and economic data will likely be the key factors affecting its stock price.
Disclaimer: The content on this site should not be considered investment advice. Investing is speculative. When investing, your capital is at risk.