
The stock market could be facing possible instability due to a significant divergence between the Dow Jones Industrial Average and the benchmark S&P 500 index.
Specifically, both indices have moved in opposite directions 50 times in the past 200 trading days, a historic divergence that hints at trouble ahead, according to data provided by financial market commentary platform The Kobeissi Letter in an X post on February 16.
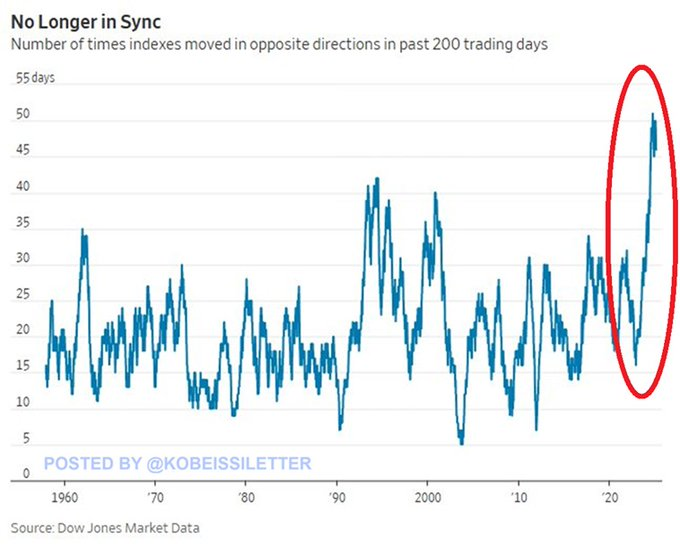
According to the platform, this disconnect has never been seen before, not even during past financial crises such as the 1994 bond market meltdown or the 2000 Dot-com bubble.
“The Dow Jones Industrial Average and S&P 500 have moved in opposite directions in 50 out of the last 200 days. Such a large divergence has never happened before,” the platform noted.
Historically, this figure fluctuated between 10 and 30 instances per period, with spikes during times of market stress.
To this end, The Kobeissi Letter suggested that the data indicates something unusual may be happening beneath the surface of the stock market.
Driver of divergence between the Dow and S&P 500
One major driver of this divergence is the dominance of large-cap technology stocks, which have pushed the S&P 500 to new highs while leaving the Dow behind. Nearly a third of the S&P 500 is weighted toward tech giants like the ‘Magnificent Seven,’ which have surged thanks to their exposure to the booming artificial intelligence (AI).
On the other hand, the Dow, with far less tech exposure, is less sensitive to AI, cloud computing, and semiconductor booms. This has led to the Dow trailing the S&P 500 by 17 percentage points over the past two years.
Such a sustained divergence is rare and often signals major market shifts. Historically, extreme gaps between indexes have preceded corrections.
The Dot-com bubble saw a similar, though smaller, split—tech stocks soared while value stocks lagged, only for the market to crash when the bubble burst.

If the current tech sector rally is overextended, this divergence could foreshadow a reversion, where inflated equities deflate, dragging the broader market down.
This growing gap is also leading to the debate over the Dow’s relevance. With only 30 stocks, it represents a narrow market share compared to the S&P 500’s 500. Its price-weighted methodology further distorts representation, giving higher-priced stocks outsized influence regardless of market value.
Critics argue this outdated calculation fails to reflect today’s market, where trillion-dollar giants in the technology space drive investor sentiment. As the economy shifts toward technology, the S&P 500 may better capture market trends than the Dow.
Another possibility is sector rotation, with investors shifting from overbought tech stocks to undervalued industrial, energy, and financial sectors—areas where the Dow has greater exposure. If this continues, the Dow could close the gap while the S&P 500 slows. But if tech dominance persists, the divergence may widen further, setting the stage for a dramatic correction.
Market crash warnings
Indeed, although the S&P 500 has been leading the market in gains, several analysts have warned that the recent momentum might signal a possible crash. For instance, economist Henrik Zeberg foresees the index hitting historical highs, which he warns will precede a devastating crash.
At the same time, the benchmark’s recent volatility, coupled with massive capital swings, has elevated concerns about an imminent downturn.
Featured image via Shutterstock