
As Bitcoin (BTC) continues to enjoy an extended stint above the crucial $110,000 support zone, technical indicators are flashing warning signs.
This comes as Bitcoin retreated further from the $120,000 resistance level amid a broader cryptocurrency market downturn.
Looking at the price outlook, the asset’s weekly Relative Strength Index (RSI) has dropped below the 14-week Simple Moving Average (SMA), a pattern that has historically signaled downturns in Bitcoin’s price, according to an analysis by cryptocurrency trading expert Ali Martinez posted on August 6.

Notably, in June 2024, a similar RSI breakdown preceded a nearly 23% decline, while another instance in December 2024 saw Bitcoin fall more than 25%. The same signal has now reappeared in early August 2025, with Bitcoin trading around $113,000.
According to Martinez, if history repeats, Bitcoin could fall between 20% and 30% from its recent highs, placing a potential downside target near $95,000.
The possibility of a further plunge is reinforced by broader market weakness, as Bitcoin failed to hold the $115,000 level.
On-chain data also supports the idea that Bitcoin may have topped out. On August 5, whales dormant for 7–10 years moved 3,000 BTC, a behavior that has historically signaled local tops. This pattern suggests investors should brace for possible losses.

Bitcoin price analysis
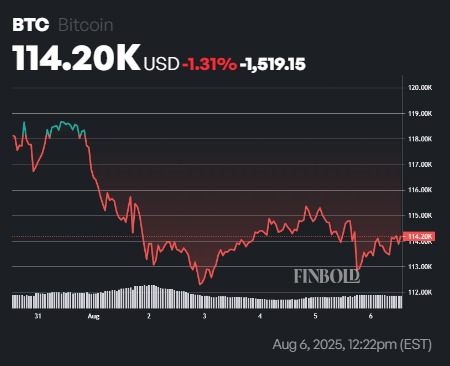
As of press time, Bitcoin was trading at $114,188, down about 0.25% in the past 24 hours and 1.3% over the past week.
At current levels, Bitcoin is slightly above its 50-day SMA of $112,473, offering short-term support. However, the 14-day RSI stands at 46.56, pointing to weakening momentum and a lack of bullish strength.
While the price remains well above the 200-day SMA of $91,911, indicating a longer-term uptrend, the neutral sentiment and RSI levels suggest potential consolidation ahead.
Featured image via Shutterstock