
Bitcoin (BTC) has fallen nearly 10% since its August 14 peak above $124,000, slipping below $110,000 multiple times amid weakening institutional demand.
In hindsight, the drop is not so surprising: September is known across equities markets as a poor month for returns and is also known as BTC’s weakest month, yielding average returns of -3.8%, followed by Uptober.
This year, capital outflows from spot Bitcoin exchange-traded funds (ETFs) further highlighted the loss of momentum, with $751 million in net redemptions in August.
Right now, “digital gold” is hovering around the $100,000 mark, but some macro developments, for example, the weakening of the U.S. Dollar Index (DXY), suggest it might be up for a rebound.
BTC price prediction
To set a BTC price target for September 30, 2025, Finbold’s AI prediction agent used multiple LLMs to generate an average forecast for improved accuracy while incorporating momentum-based indicators into its context. You can experiment with the existing prompts or create your own. Try here now.
According to the artificial intelligence (AI) agent, the average BTC price on September 30 will be $101,500, down -7.89% from the current price of $110,191.
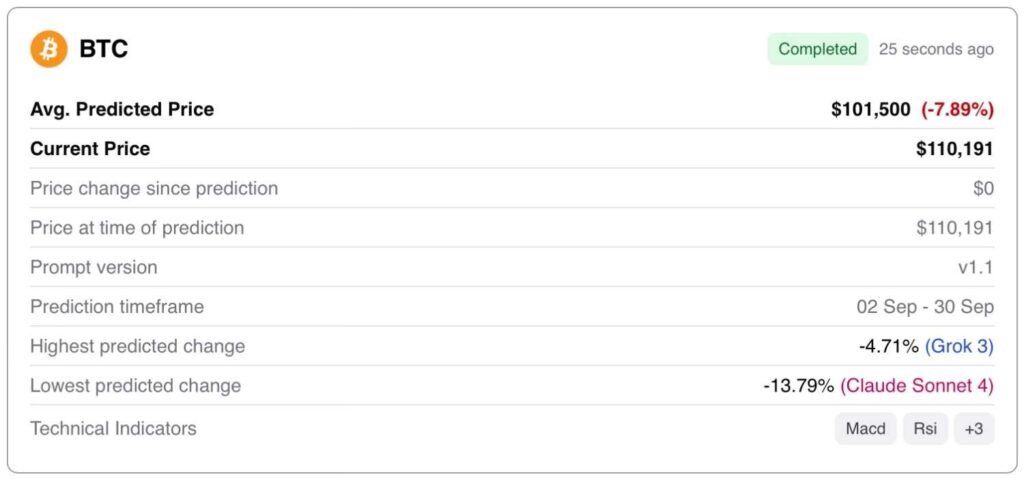
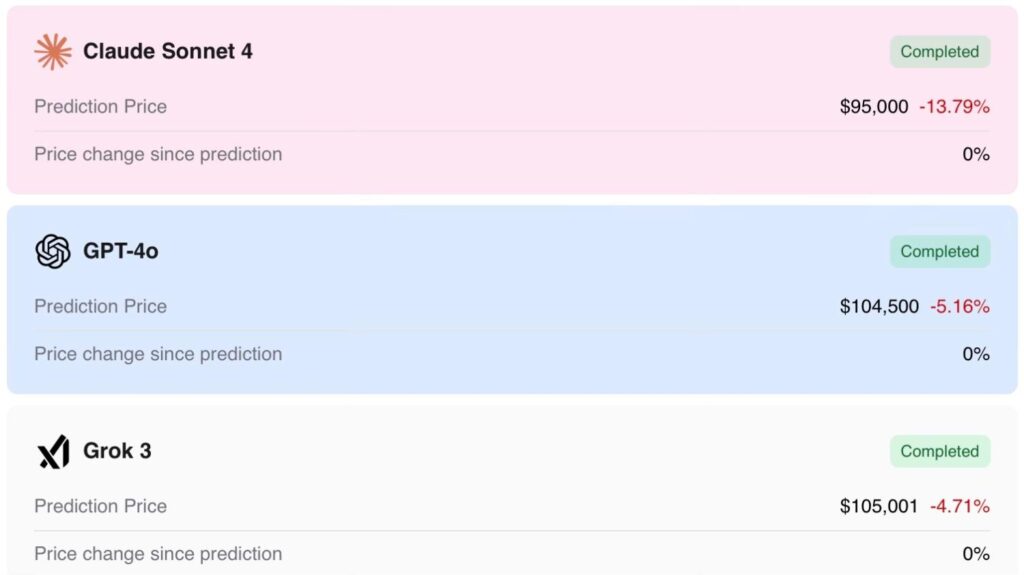
All three language learning models (LLMs) used in the prediction were bearish.
Claude 4 Sonnet offered the most negative projection, predicted a BTC price of just $95,000, which translates to a downside of no less than -13.79%.
GPT-4o and Grok 3 were also pessimistic, with target prices of $104,500 (-5.16%) and $105,001 (-4.71%), respectively.
Taking a look at Bitcoin’s technicals, it appears that the bearish projections are justified, although there are some early signs that the downside pressure might slow down.
The moving average/convergence divergence (MACD) remains negative at -1,991, below the signal line at -1,460, which paints a bearish picture. However, the histogram’s slight improvement at -450.86 suggests selling pressure may be easing.
On the other hand, the relative strength index (RSI) sits at 43, not only underscoring the bearish bias but also leaving room for further weakness as it suggests the digital currency is not yet oversold.
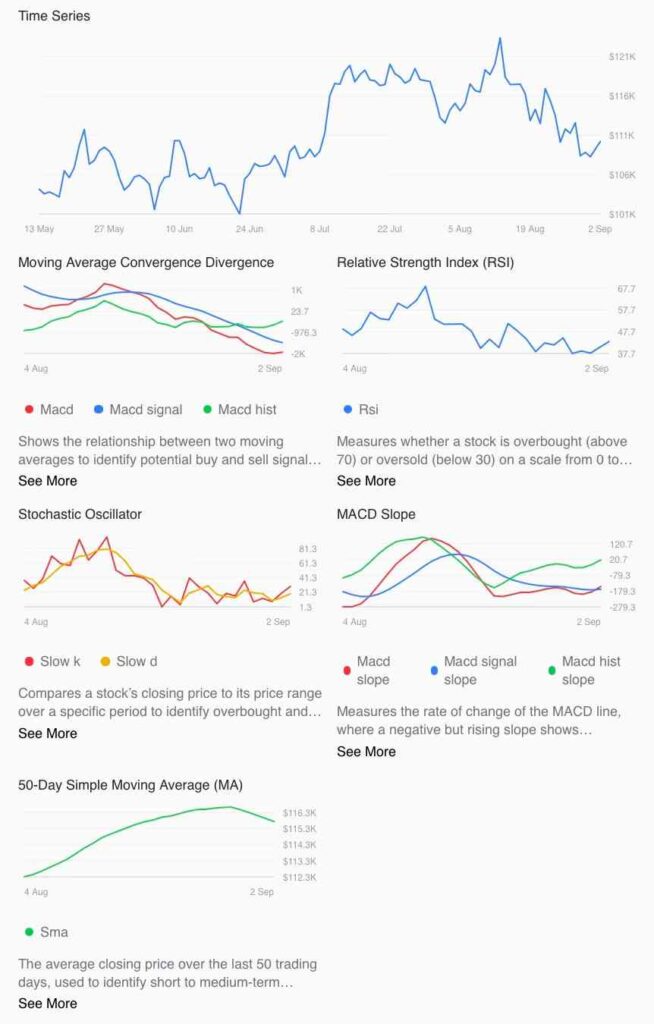
The stochastic oscillator (%K 29.1, %D 19.1), though, does signal oversold conditions, but shows a minor bullish crossover, hinting at the potential for a short-term bounce.
Still, BTC remains well under its 50-day moving average (MA) of $115,755, reinforcing the broader downtrend.
Featured image via Shutterstock