
While not without competition, Nvidia (NASDAQ: NVDA) is still the king of the semiconductor industry. However, some recent market developments, in particular the company’s obligation to pay the government a 15% share on some of its sales in China as part of the renewed shipping deal, have generated a lot of speculation regarding the short-term future of the stock.
Also contributing to the debate is the upcoming earnings report, scheduled for August 27, which is expected to be another major catalyst, especially now that Nvidia’s market capitalization has surpassed $4 trillion.
Nvidia stock price prediction
As investors are eagerly expecting to see how the S&P 500 will react to Nvidia’s earnings report later next week, we projected a potential NVDA stock price target for September 1 by leveraging Finbold’s AI prediction agent, which used multiple LLMs to generate an average forecast for improved accuracy while incorporating momentum-based indicators into its context.
The artificial intelligence (AI) predicted the average NVDA price on September 1 would be $179.77, 4.86% up 3.26% from the current price of $174.09.
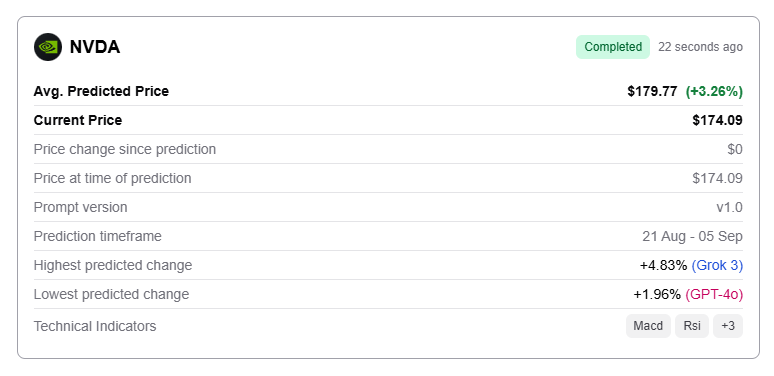
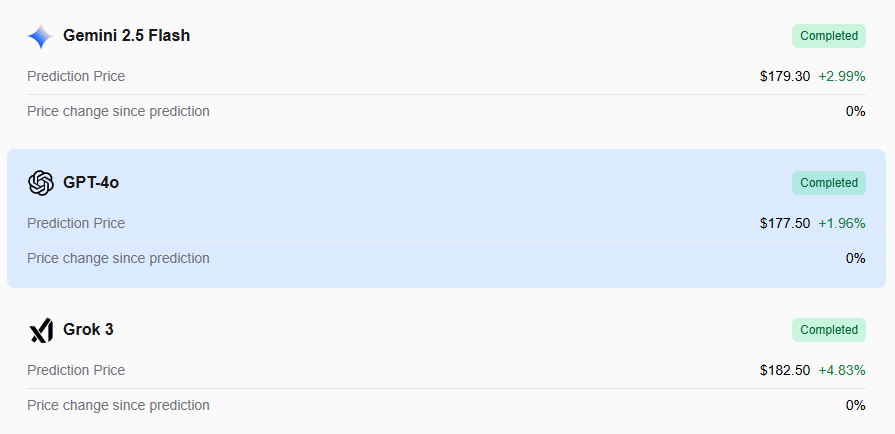
All three language learning models used in the prediction were positive in their outlook.
Grok 3 was the most bullish, predicting the chip maker’s shares would trade at $182.50 by the end of the month, up 4.86% from the current price.
OpenAI’s model forecasted a price of $177.50, seeing a potential upside of +1.99%, while its Google competitor set the price at $$179.30, implying an upside potential of 3.02%.

NVDA stock is currently trading at $175.13 while showing a mixed technical outlook.
The moving average convergence divergence (MACD) line (3.758) sits below the signal line (5.225), producing a bearish crossover with a negative histogram (–1.467). All slopes are also negative, confirming that momentum is weakening in the short term.
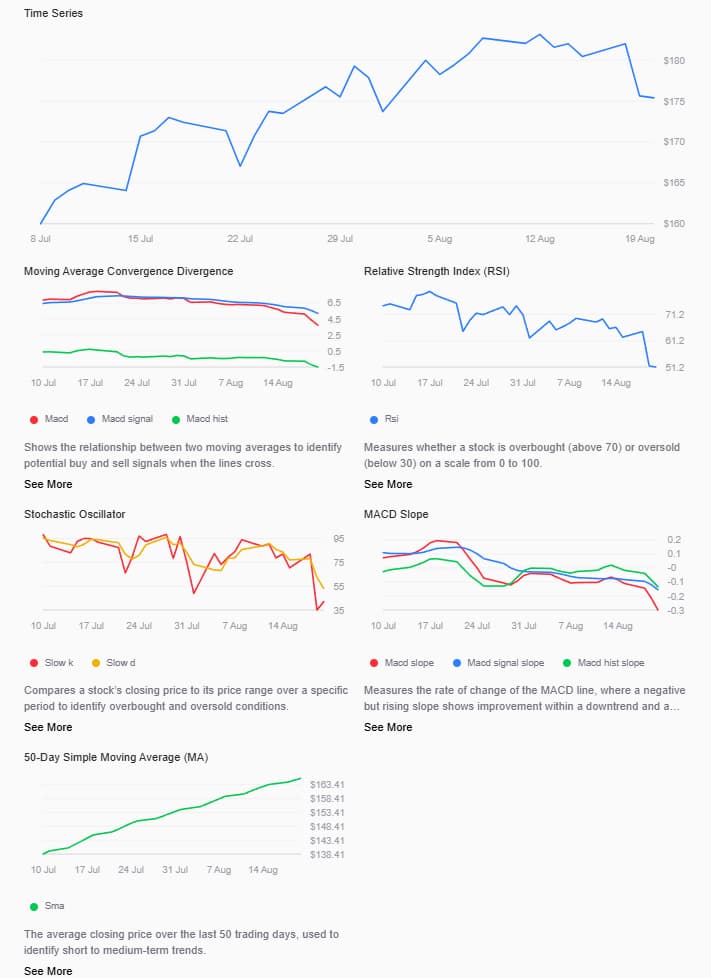
At the same time, the stock remains above its 50-day moving average (MA) of $165.67, which suggests that the medium-term uptrend is intact.
Momentum oscillators paint a more neutral picture. The stochastic oscillator shows %K at 42.092, below %D at 52.995, indicating mild short-term bearishness. Similarly, the relative strength index (RSI) stands at 51.247, right around the midpoint, showing balanced momentum without overbought or oversold conditions.
Featured image via Shutterstock