

Meta Platforms (NASDAQ: META) could rally to $1,000 after completing a potential correction, according to a long-term technical analysis of its rising price channel.
The analysis, shared by TradingShot in a TradingView post on October 23, projects a rebound toward the 1.618 Fibonacci extension at $1,000, provided META maintains its long-term uptrend.
TradingShot noted that Meta stock has traded within a long-term ascending channel since its 2012 initial public offering (IPO), with much of its price action remaining between the 0.5 and 1 Fibonacci levels.
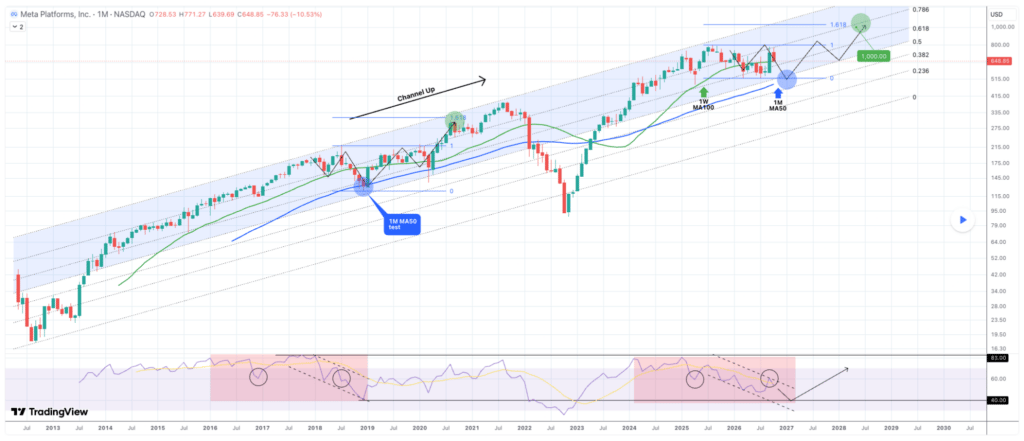
META stock’s potential correction
The latest pullback follows a double-top rejection after September’s high, with the stock already testing its weekly 100-period moving average, shown by the green trend line.
However, the analysis suggests the pullback could deepen, leaving META vulnerable to a decline toward $550 to $500 as the U.S. midterm elections approach.
This range coincides with the monthly 50-period moving average (MA) and the 0.5 Fibonacci level, potentially providing a significant support zone.
A similar setup occurred in December 2018, when Facebook stock tested its monthly MA50 before recovering and eventually reaching new all-time highs.
TradingShot identifies that correction as a potential historical fractal for the current price action. If the pattern repeats, META could bottom near the projected support zone before resuming its long-term advance.
However, historical comparisons don’t guarantee the same outcome, and a sustained break below support would weaken the bullish outlook.
META stock technical analysis targets $1,000
Despite the potential near-term downside, TradingShot’s long-term Meta stock price prediction remains bullish, with the 1.618 Fibonacci extension pointing to a target of $1,000.
From its October 23 closing price of $642, the target represents approximately 55.6% upside. Reaching that level would require Meta to recover from its current pullback and resume its advance within the ascending channel.
The monthly relative strength index (RSI) provides another potential bullish signal. If the indicator falls to 40 before META tests its monthly MA50 or reaches $550.
Such a reading could signal a potential recovery, although it would not confirm that a reversal had begun.
Meta’s financial performance will also influence whether the stock can recover and sustain its longer-term uptrend.
The company reported third-quarter 2026 revenue of $64.60 billion on October 21, up 26% year over year. Advertising remained strong, with ad impressions increasing 10% and the average price per advertisement rising 14%. Meta also reported 3.64 billion daily active people across its family of applications in September.
However, total costs and expenses increased 68% to $51.61 billion, including a $9.89 billion legal charge related to an agreement with 52 U.S. state attorneys general. Meta reported operating income of $12.99 billion and negative free cash flow of $2.12 billion for the quarter.
The company expects fourth-quarter revenue of $73 billion to $76 billion and full-year 2026 expenses of $175 billion to $179 billion. Capital expenditure is projected at $135 billion to $145 billion this year, reflecting continued investment in artificial intelligence infrastructure and other initiatives.
Meta said its AI investments are already generating additional advertising revenue through stronger engagement, improved recommendations, and more efficient monetization.
Sustaining that growth while managing infrastructure costs will be crucial to its longer-term performance.
Featured image via Shutterstock