
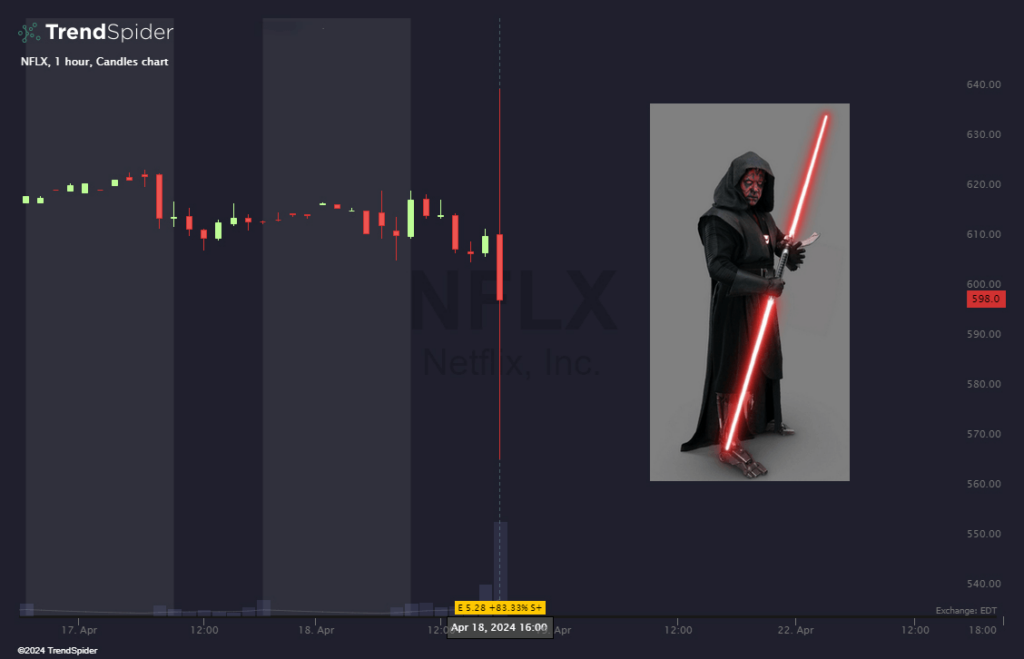
Following robust revenue figures in its Q1 report, one might anticipate that Netflix‘s stock (NASDAQ: NFLX) will rise. Surprisingly, the price chart revealed a rare and ominous pattern called the Darth Maul pattern.
This pattern, formally termed a ‘high wave spinning top,’ features a small candle body with exceptionally large upper and lower shadows, indicating a period of uncertainty in the previous trend.
The nickname ‘Darth Maul’ is derived from Star Wars, as the candle’s appearance resembles a double-edged red lightsaber.
Investors might be curious about the implications of this pattern’s emergence. Could it be a sign of a potential downturn in Netflix stock? Or is it merely a temporary blip? The answer, as always, lies in transparency.
Investors prefer to know all the numbers regarding Netflix
Netflix surprised investors by announcing it would no longer report subscriber numbers each quarter, signaling a potential slowdown in streaming customer growth.
Despite reporting a large influx of new customers in the first quarter, the company’s stock fell due to a revenue forecast that missed analyst expectations.
Netflix executives emphasized the importance of focusing on revenue and operating margins rather than customer additions.
Beginning with the first quarter of 2025, Netflix will only disclose subscriber numbers when major milestones are reached, a decision likely to unsettle investors and complicate future business modeling for Wall Street analysts.
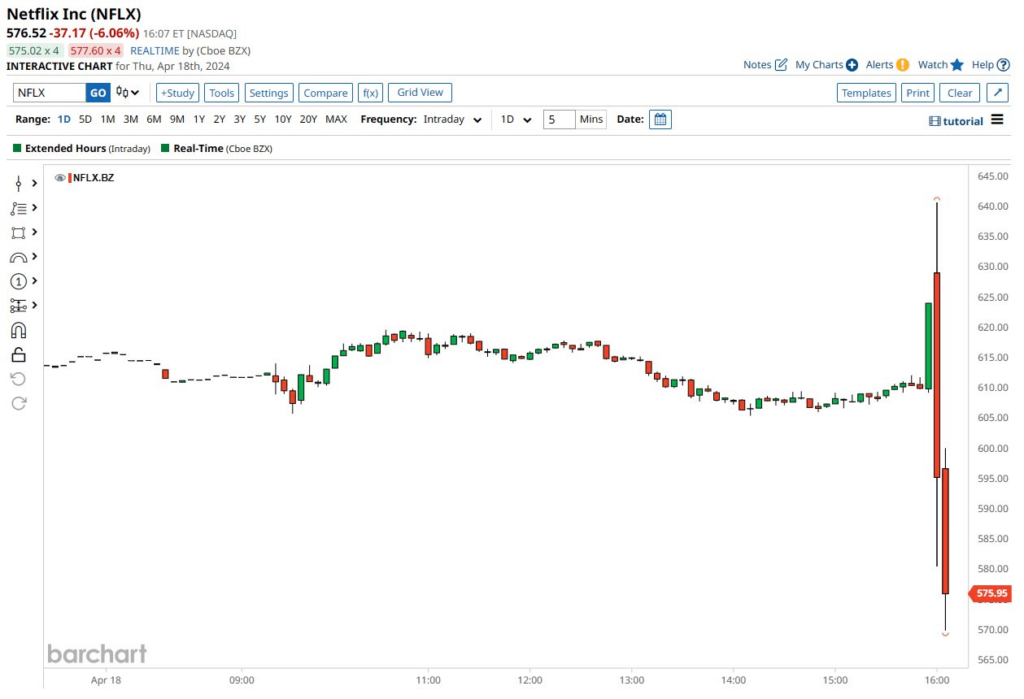
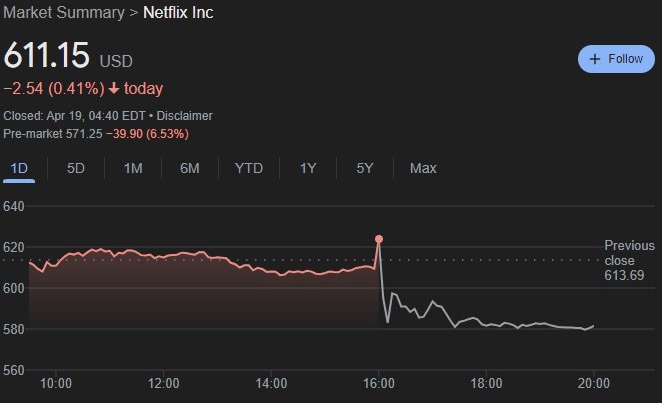
NFLX stock price chart
As of the most recent close on April 18, NFLX stock was trading at $611.15, reflecting a 6.53% decline that continued into pre-market trading. This loss adds to the 2.75% downturn experienced over the past five trading sessions.
Despite this recent dip, NFLX shares have shown a noteworthy increase in valuation on the year-to-date price chart, climbing by 30.45%.
It’s premature to determine whether the trend observed in NFLX shares following the announcement of subscription non-disclosure will continue. However, one thing is certain: investors prefer access to all data when analyzing companies and their stocks.
Buy stocks now with eToro – trusted and advanced investment platform
Disclaimer: The content on this site should not be considered investment advice. Investing is speculative. When investing, your capital is at risk.