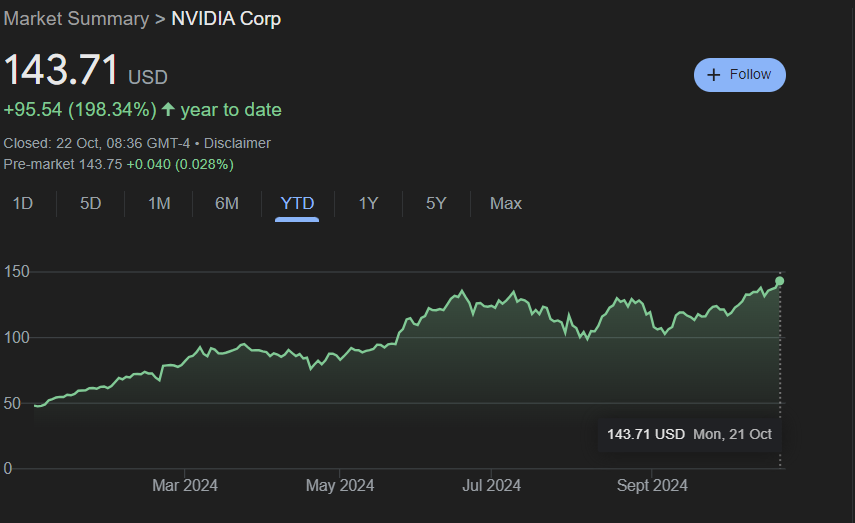
Nvidia’s (NASDAQ: NVDA) meteoric rise saw the stock tap another all-time high, but analysis of the equity’s relative strength index (RSI) suggests this momentum might be short-lived.
The stock closed up 4.14% to $143.71 during the latest session. In 2024, the semiconductor giant is now up 190.2% year-to-date.
Despite NVDA’s apparent strength in the price breakout, technical signals suggest caution might be warranted, with the RSI entering oversold territory, according to CyclesFan’s analysis shared on October 21.
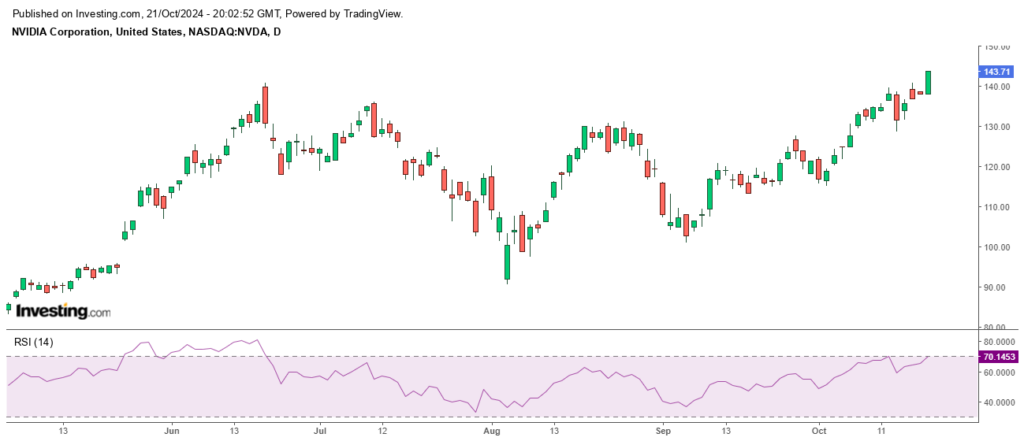
The value stands at 70.14, showing a negative divergence compared to Nvidia’s previous closing high on October 14. Divergence occurs when the price makes higher highs, but the RSI fails to do the same, suggesting that the upward momentum is weakening.
“There’s still a reason for concern since RSI(14) has a negative divergence vs. the Oct 14 close,” the expert said.
CyclesFan pointed out that the daily RSI divergence isn’t necessarily alarming in isolation. The expert mentioned that compared to Nvidia’s performance from May to June, the RSI still has room to run higher before any significant concerns about overbought conditions arise. If the divergence is erased in the coming sessions, the breakout could be further validated, strengthening Nvidia’s bullish case.
To add context, the expert compared Nvidia’s current price action with its history since 2020, noting that its RSI topped 85 five times, marking key highs. Therefore, the divergences matter only within the same intermediate cycle, like the summer 2023 divergence, which predicted a pullback.
What next for NVDA share price?
It’s worth noting that despite facing volatility in recent weeks, Nvidia’s latest record high cements NVDA’s position as one of the best-performing stocks of 2024.

This performance is raising concerns that the equity’s run might end soon. To this end, Finbold reported that Nvidia’s chart has flashed bearish sentiment, indicating that the stock has formed a double-top pattern year-to-date, as observed by Alan Santana.
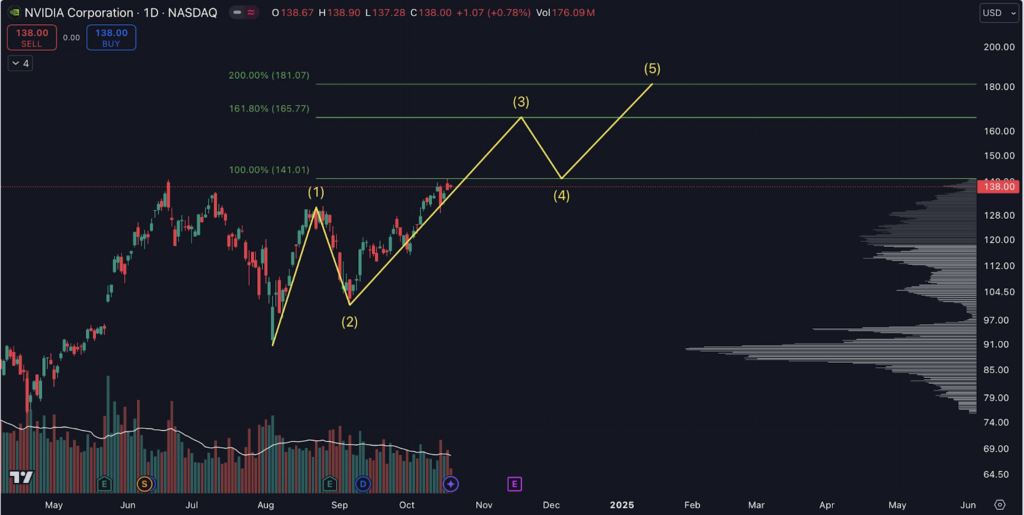
Away from the RSI concerns, technical market analyst Chart Wave Trading observed in an X post that NVDA’s technical setup could be signaling a push toward $180. The analysis noted that the stock appears to be setting up for a bullish move after successfully holding the critical 0.786 Fibonacci retracement level, with a long wick confirming support for wave 2 of its Elliott Wave structure.
Moreover, NVDA’s share price broke and closed above the 50-day simple moving average, signaling upward momentum. The daily chart shows a buildup of bullish divergence on both the RSI and moving average convergence divergence (MACD), indicating increasing buying pressure.
Wall Street’s take on NVDA stock
With the possibility of a Nvidia crash remaining intact, most Wall Street analysts are optimistic about sustained gains in the coming months. On October 14, Citi (NYSE: C) raised its price target to $150. Similarly, Vivek Arya of BofA Securities reiterated his buy rating, raising his target from $165 to $190.
The positive outlook stems from Nvidia’s role in the artificial intelligence scene, where market players believe the rollout of the company’s Blackwell chips will be a key game changer. In this context, Wedbush analyst Dan Ives sees Nvidia as a key player in the AI market while forecasting the sector’s 10x growth by 2027.
Amid the positive momentum, the chipmaker faces potential headwinds, particularly around the possible U.S. government importation restrictions to Persian Gulf countries. The White House has already barred the sale of advanced chips to select countries in the Middle East, Africa, and Asia to stay ahead of China in the AI arms race.