After a blissful period of constant price increases fueled by the artificial intelligence (AI) craze, Nvidia (NASDAQ: NVDA) stock has started to slow down, even recording some major dips in the past few weeks, and currently, it is residing in the “sweet spot” between two key price levels.
Specifically, Nvidia shares are currently “RIGHT in the sweet spot” between the 0.618 Fibonacci retractement level of $106.19 acting as a strong support and resistance in the previous high of $131.26, according to the observations shared by the markets analytics platform TrendSpider in an X post on September 15.
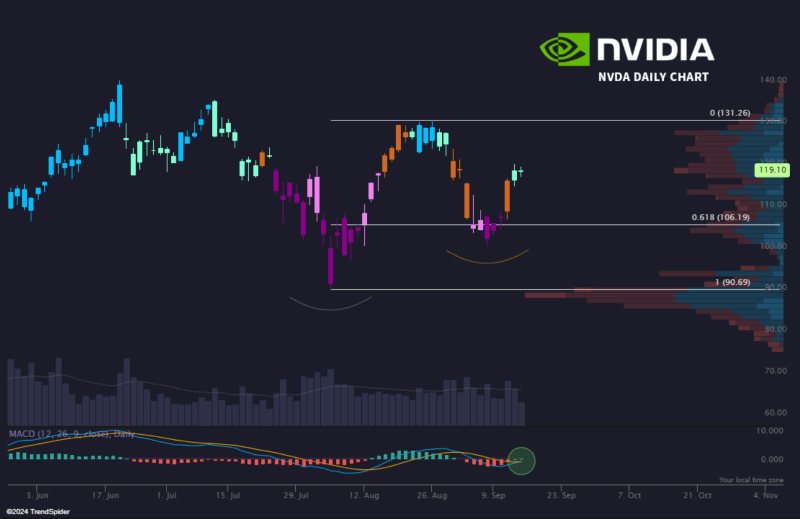
In other words, investors should keep an eye on these two critical price levels and the lower resistance at $90.69, to which NVDA stocks dropped in early August and which marked this year’s bottom for the semiconductor behemoth, but also represents the zone where buyers might enter the market.
Picks for you
Furthermore, the chart shared by TrendSpider shows a visible spike in volume at the $106.19 level, which indicates significant trading activity around this price, adding up to the argument that it represents solid support, whereas lower volumes as the price goes up suggest decreased interest at higher levels.
Bullish?
At the same time, Nvidia’s price performance on this chart suggests a double-bottom pattern, which typically indicates the end of a downtrend and the possible beginning of an uptrend, and the stock will confirm this once its price breaks the neckline, which could happen in the near future.
Finally, the platform’s analysts have included the moving average convergence divergence (MACD) indicator, which appears to be crossing above the signal line and which, in addition to the histogram turning green, is a bullish indicator, suggesting that upward momentum is building for Nvidia stock.
Nvidia stock price history
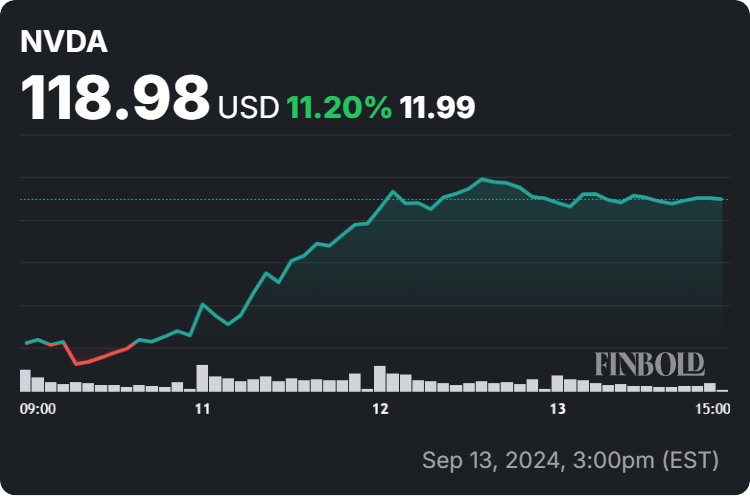
Meanwhile, the Nvidia stock price stands at $118.98 in pre-market, which is above the key 0.618 Fibonacci level specified by TrendSpider but also suggests a decline of 0.11% on the day, an increase of 11.20% across the previous week, a 9.70% drop in the past month, and a 143.72% gain since the year’s turn, as per data on September 16.
All things considered, Nvidia stock does seem to be in the sweet spot, as it is in an upward trend after finding support at the above Fibonacci level, and breaking the resistance at $131.26 could send it further upward, supported by the positive momentum from the MACD indicator.
That said, trends in the stock market can change easily and suddenly, so doing one’s own research, carefully weighing the risks, and keeping up with any important developments is critical when investing more significant amounts of money in any asset.
Buy stocks now with eToro – trusted and advanced investment platform
Disclaimer: The content on this site should not be considered investment advice. Investing is speculative. When investing, your capital is at risk.