Macroeconomic indicators suggest the gold/silver ratio could bottom at 77, further increasing gold‘s long-term dominance over silver.
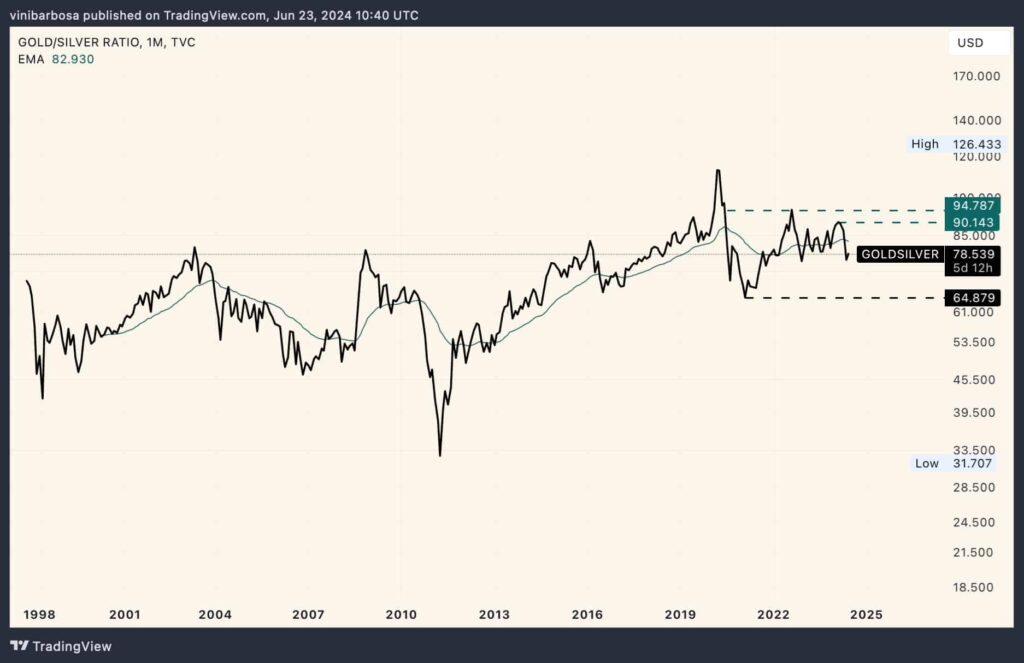
The gold/silver ratio is an important finance indicator that measures how much a once of gold can buy of silver, comparing the market price of the two leading commodities. This index has been surging in an uptrend since April 2011, favoring gold over silver.
Notably, the gold/silver ratio made an all-time low in April 2011 at 31.70 ounces of silver, buying one of gold. At that time, silver peaked at an all-time high of $49.83 per ounce amid inflation and government solvency concerns. Meanwhile, gold was priced at $1,400, and it has shown steady growth since the 1999 bottom.
Since then, gold has reconquered its dominance against silver, with the ratio peaking at 126.43 in March 2020. Interestingly, the index reached its all-time high during the COVID-19 crash, with gold surging as the ultimate worldwide crisis hedge.
As of this writing, the gold/silver ratio is at 78.54, floating in a range between 64.88 and 94.78. Silver has overperformed gold since February 2024, but macroeconomic indicators suggest this short-term trend is ending.
Commodity expert believes the gold/silver ratio could bottom again
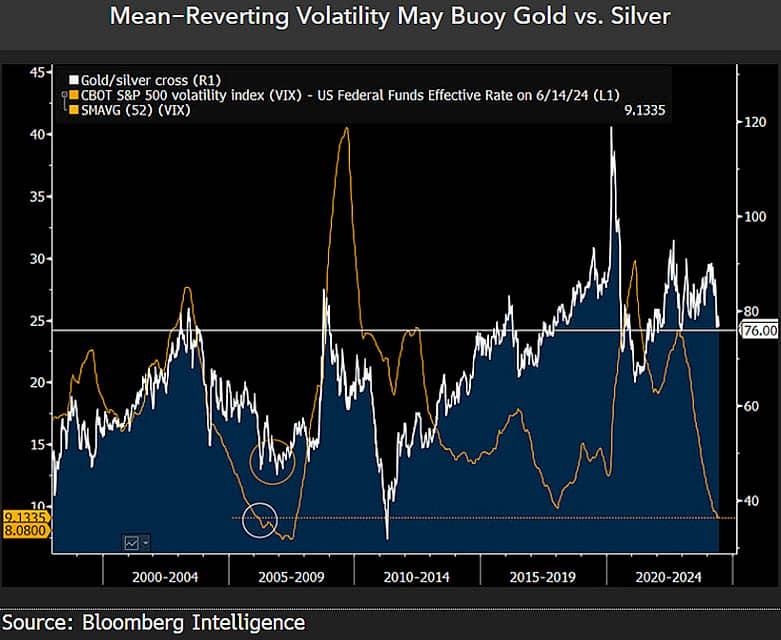
On that note, Mike McGlone, Senior Commodity Strategist at Bloomberg Intelligence, highlighted a macro indicator with a potential impact on the gold/silver ratio, suggesting the index could bottom again while gold increases its dominance.
He compared it with the S&P 500 volatility index weighted by the US Federal funds, measuring interest rates. The proportionally low volatility for the stock market against record interest rate hikes creates a concerning recession environment, fueling gold.
In particular, McGlone pointed to a multi-year low on this finance indicator that resembles the period between 2005 and 2009. At this time, the gold/silver ratio bottomed, starting the uptrend. Mike McGlone believes it could happen again now, making the 77 ratio a bottom for gold’s price against silver.
“The last time the US stock market’s options volatility reached a similar low vs. high rates was 2006, about when the gold/silver cross bottomed around 45. I see parallels at about 77 on June 20.”
– Mike McGlone, in a post on X
While speculation increases on the next steps for these commodities and other markets, gold trades at $2,321, and silver at $29.53 per ounce. Thus, investors could consider both precious metals as a financial hedge while adjusting accordingly as the scenario changes.
Disclaimer: The content on this site should not be considered investment advice. Investing is speculative. When investing, your capital is at risk.