Skip to content

Recession Warren Buffett indicator hits record levels

Recession Warren Buffett indicator hits record levels
Paul L.
Finance

The Warren Buffett indicator, a popular measure of market valuation, has surged 220%, signaling that U.S. equities are more stretched relative to the economy than at any point in history.

By comparison, the ratio peaked at around 190% during the height of the Dot-com bubble in 2000.

Warren Buffett indicator. Source: Barchart

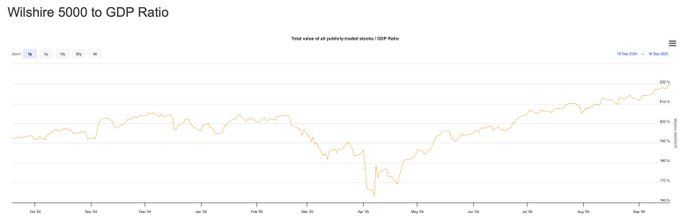
The Buffett indicator, calculated as the total market capitalization of all publicly traded U.S. stocks relative to gross domestic product (GDP), is often cited as a broad gauge of whether equities are overvalued or undervalued. 

Notably, when the ratio is elevated, it suggests that market prices have run far ahead of underlying economic growth.

The ratio has steadily climbed through 2024 and 2025, with only brief pullbacks, before breaking past its previous historic highs. 

What’s driving high market valuation

Several factors appear to be fueling this record level. For instance, persistent investor enthusiasm for technology stocks, led by giants such as Nvidia (NASDAQ: NVDA), has propelled valuations higher. 

At the same time, optimism around artificial intelligence (AI), easing inflationary pressures, and expectations of further interest rate cuts from the Federal Reserve have also bolstered risk appetite. 

Meanwhile, corporate earnings have generally outperformed expectations, further justifying elevated multiples in the eyes of many investors.

However, the record-setting ratio has revived concerns about overheating markets. Historically, high Buffett Indicator readings have preceded periods of correction or slower returns, as witnessed after the Dot-com bubble burst. 

This comes as several analysts warn of a potential market correction and even the possibility of a looming recession.

Others, however, contend that structural shifts, such as the growing dominance of tech firms, globalization, and the rise of intangible assets, may justify a higher “normal” baseline for the indicator compared with past decades.

The question now is whether the market can sustain its momentum or whether history will once again repeat itself.

Featured image via Shutterstock

Best Crypto Exchange for Intermediate Traders and Investors

  • Invest in cryptocurrencies and 3,000+ other assets including stocks and precious metals.

  • 0% commission on stocks - buy in bulk or just a fraction from as little as $10. Other fees apply. For more information, visit etoro.com/trading/fees.

  • Copy top-performing traders in real time, automatically.

  • eToro USA is registered with FINRA for securities trading.

30+ million Users worldwide
Securities trading offered by eToro USA Securities, Inc. (“the BD”), member of FINRA and SIPC. Cryptocurrency offered by eToro USA LLC (“the MSB”) (NMLS: 1769299) and is not FDIC or SIPC insured. Investing involves risk, and content is provided for educational purposes only, does not imply a recommendation, and is not a guarantee of future performance. Finbold.com is not an affiliate and may be compensated if you access certain products or services offered by the MSB and/or the BD

Latest posts

Finance Digest

By subscribing you agree with Finbold T&C’s & Privacy Policy

Related posts

Finance

Finbold AI Agent

How AI Price Predictions Work

We use cutting-edge AI models to forecast future prices for stocks and crypto.

Trade, Swap & Stake Crypto on Uphold

Buy, sell, and swap crypto. Stake crypto, earn rewards and securely manage 300+ assets—all in one trusted platform. Terms apply. Capital at risk.

Get Started

IMPORTANT NOTICE

Finbold is a news and information website. This Site may contain sponsored content, advertisements, and third-party materials, for which Finbold expressly disclaims any liability.

RISK WARNING: Cryptocurrencies are high-risk investments and you should not expect to be protected if something goes wrong. Don’t invest unless you’re prepared to lose all the money you invest. (Click here to learn more about cryptocurrency risks.)

By accessing this Site, you acknowledge that you understand these risks and that Finbold bears no responsibility for any losses, damages, or consequences resulting from your use of the Site or reliance on its content. Click here to learn more.