Skip to content

No results found

To keep going please Log in.

or

By submitting my information, I agree to the Privacy Policy and Terms of Service.

To keep going please Log in.

or

By submitting my information, I agree to the Privacy Policy and Terms of Service.

To keep going please Log in.

or

By submitting my information, I agree to the Privacy Policy and Terms of Service.

To keep going please Log in.

or

By submitting my information, I agree to the Privacy Policy and Terms of Service.

S&P 500 set for ‘total collapse’ if this level fails to hold, according to expert

S&P 500 set for ‘total collapse’ if this level fails to hold, according to expert
Paul L.
Stocks

A trading expert is warning that the S&P 500 is approaching a critical technical juncture that could determine whether the broader market remains in a long-term uptrend or slips into a new bear cycle.

Insights by TradingShot, shared in a TradingView post on March 17, base the outlook on the fact that the benchmark index closed two consecutive weekly candles below its 100-day moving average (MA), a development flagged as the first clear bearish confirmation signal.

S&P 500 analysis chart. Source: TradingView

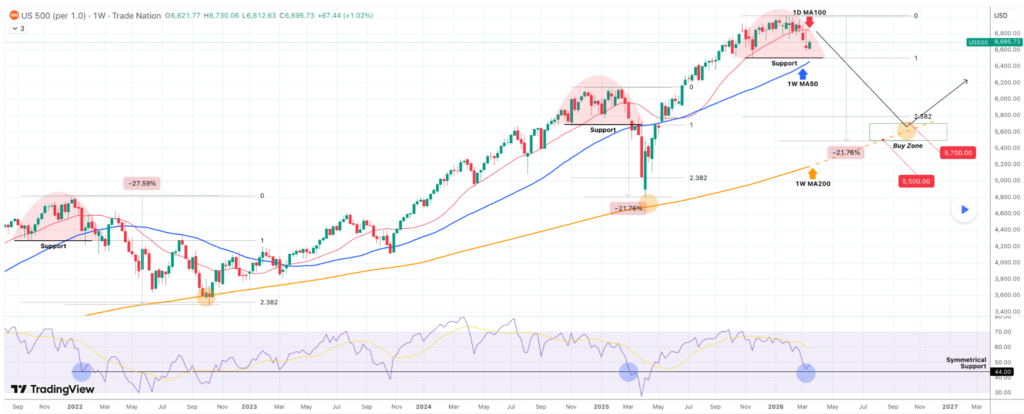
Attention has now shifted to the 50-week MA at around 6,500, which is acting as the final major support level separating bullish continuation from a broader structural downturn.

The outlook notes this level aligns with an arc-shaped topping pattern that has historically preceded sharp corrections. 

In past drawdowns, including the 2022 inflation bear market and the 2025 tariff sell-off, the S&P 500 tested this same support while the weekly RSI hovered in the mid-40s, similar to current conditions, signaling a potential decisive breakdown.

If the 50-week moving average breaks, the analysis points to a move toward the 200-week moving average, the market’s key long-term support. 

This would mirror past corrections that extended to the 2.382 Fibonacci level, with declines of about 27.6% and 21.8%, signaling substantial downside risk.

S&P 500 next lower target 

Based on this pattern, TradingShot noted that the S&P 500 could find a long-term accumulation zone between 5,700 and 5,500, aligning with the Fibonacci target and a typical correction range while remaining slightly above the 200-week average. 

If the index falls to the lower end of the projection, it would imply an 18% drop from the last closing value of 6,716.

S&P 500 one-day chart. Source: Google Finance

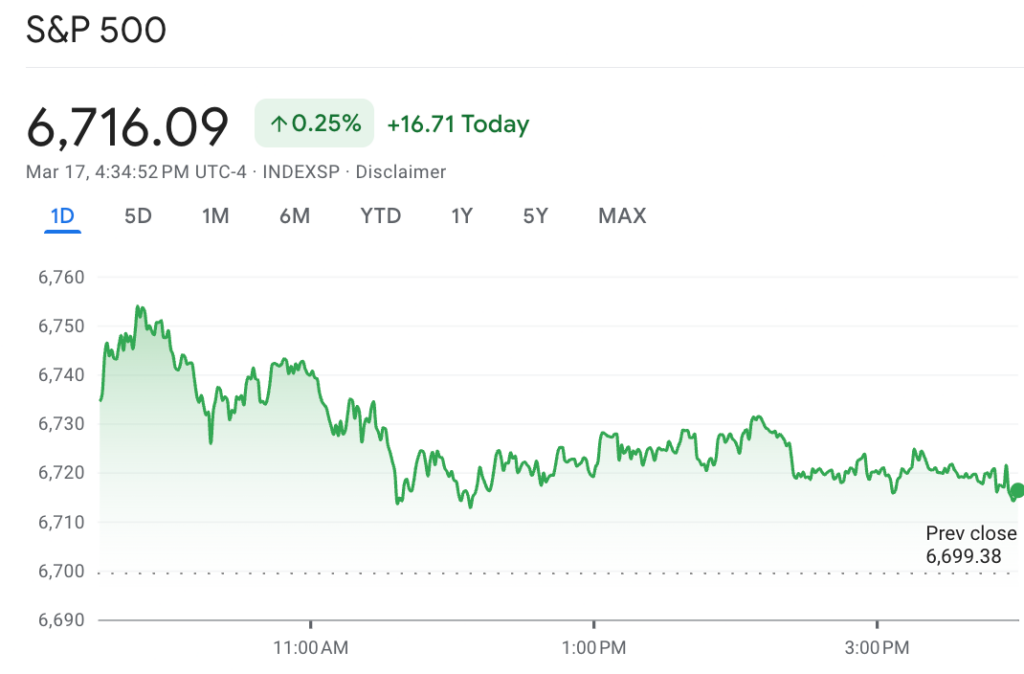
This outlook comes at an interesting time, considering the index has traded in a narrow range this month, rebounding from dips tied to oil supply concerns in the Strait of Hormuz.

While oil prices spiked toward $100 per barrel at their peaks, the S&P 500 has demonstrated underlying strength, with limited sell-offs and rotations into energy and defensive sectors.

Analysts remain cautiously optimistic for 2026, driven by solid corporate earnings growth, AI productivity gains, and economic resilience. 

Investors are now eyeing the Federal Reserve’s upcoming meeting for clarity on rates amid the uncertain backdrop.

Featured image via Shutterstock


Best Crypto Exchange for Intermediate Traders and Investors

  • Invest in cryptocurrencies and 3,000+ other assets including stocks and precious metals.

  • 0% commission on stocks - buy in bulk or just a fraction from as little as $10. Other fees apply. For more information, visit etoro.com/trading/fees.

  • Copy top-performing traders in real time, automatically.

  • eToro USA is registered with FINRA for securities trading.

30+ million Users worldwide
Securities trading offered by eToro USA Securities, Inc. (“the BD”), member of FINRA and SIPC. Cryptocurrency offered by eToro USA LLC (“the MSB”) (NMLS: 1769299) and is not FDIC or SIPC insured. Investing involves risk, and content is provided for educational purposes only, does not imply a recommendation, and is not a guarantee of future performance. Finbold.com is not an affiliate and may be compensated if you access certain products or services offered by the MSB and/or the BD
Finbold Career

Join Finbold's newsroom, become a crypto reporter today!

Apply now to join Finbold as a crypto/finance news writer!

Latest posts

Finance Digest

By subscribing you agree with Finbold T&C’s & Privacy Policy

Related posts

Finbold AI Agent

How AI Price Predictions Work

We use cutting-edge AI models to forecast future prices for stocks and crypto.

Home

No results found

IMPORTANT NOTICE

Finbold is a news and information website. This Site may contain sponsored content, advertisements, and third-party materials, for which Finbold expressly disclaims any liability.

RISK WARNING: Cryptocurrencies are high-risk investments and you should not expect to be protected if something goes wrong. Don’t invest unless you’re prepared to lose all the money you invest. (Click here to learn more about cryptocurrency risks.)

By accessing this Site, you acknowledge that you understand these risks and that Finbold bears no responsibility for any losses, damages, or consequences resulting from your use of the Site or reliance on its content. Click here to learn more.