
Although the stock market appears to be rallying, a concerning trend is emerging that spells possible doom for the sector, pointing toward uncertainty.
Particularly, data shared on June 16 by capital markets commentary platform The Kobeissi Letter revealed that the current state of the S&P 500 shows a striking resemblance to the 2000 Dot-com bubble.
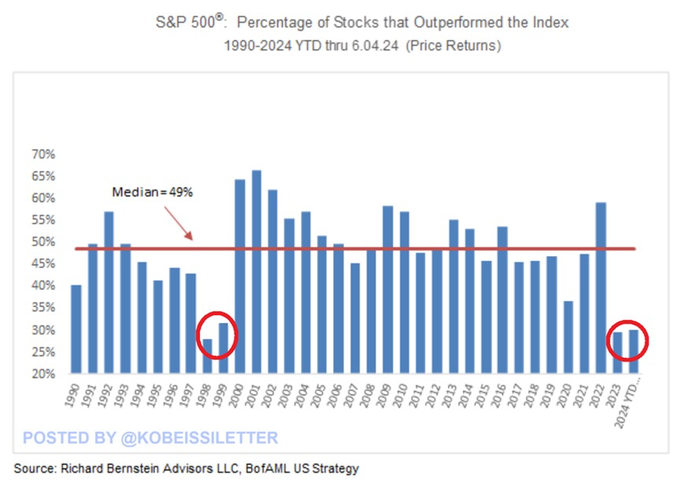
According to the data, only 30% of S&P 500 stocks have outperformed the index year-to-date. This is only slightly improved from the 29% recorded in 2023, marking a consecutive year of unusually low market breadth.
Notably, a look at the historical data spanning from 1990 to June 2024 highlights the significance of this trend. Historically, the median percentage of S&P 500 stocks outperforming the index is 49%, indicative of robust and broad market participation.
Lessons from the Dot-com bubble
In stark contrast, the back-to-back years of underperformance seen in 2023 and 2024 recall a similar pattern last observed during the infamous 2000 Dot-com bubble.
While most years since 1990 have seen a healthier distribution of outperforming stocks, the periods 1998-1999 and 2023-2024—stand out for their markedly lower percentages. The Dot-com bubble saw a similar concentration of gains in a small subset of stocks, leading to a market characterized by narrow leadership and, ultimately, significant volatility.
This trend is particularly concerning given that the S&P 500 has rallied 12% year-to-date, a surge driven predominantly by a handful of tech giants. This concentration raises questions about the rally’s sustainability.
It echoes the conditions that led to the Dot-com crash, where the market’s dependence on a few high-flying stocks resulted in a sharp correction when those stocks stumbled.
Generally, the narrow breadth suggests that while the index is rising, the gains are not widely distributed across the market, increasing the risk of volatility should those few leading stocks face setbacks.
Tech stocks dominate S&P 500
Indeed, the recent rally in the index has been led by technology stocks, with companies that ventured into artificial intelligence (AI) emerging as the biggest movers. For instance, semiconductor giant Nvidia (NASDAQ: NVDA) soared in the short term, leading its market cap to cross $3 trillion for the first time. Apple’s (NASDAQ: AAPL) market cap has also risen above $3 trillion for the first time since January, with the two companies vying to emerge as the second largest in the world.
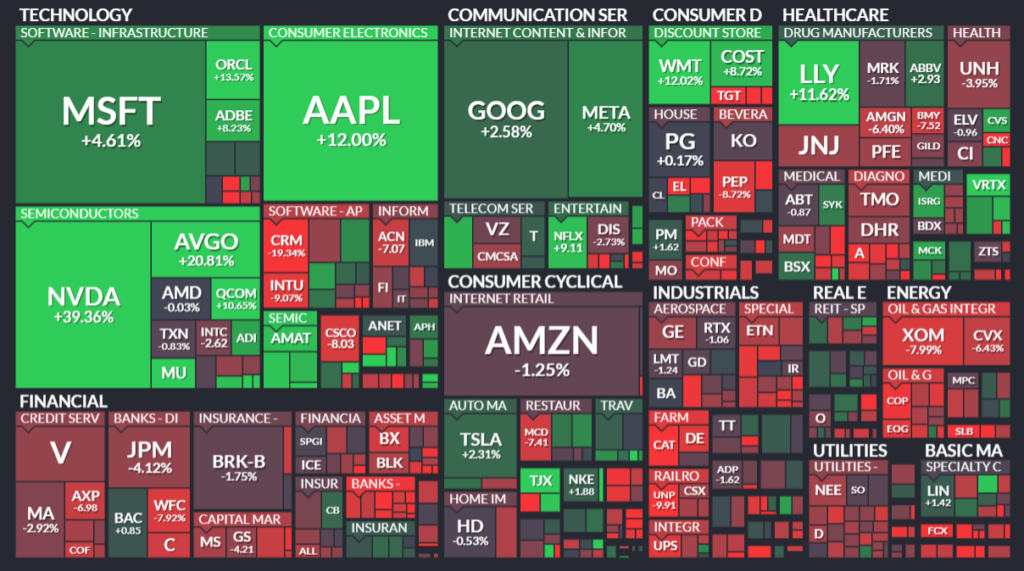
Overall, this concentration on a few companies poses significant risks, as the index’s performance relies heavily on a handful of firms. The uncertainty heightens, considering prevailing fears that the AI stock bubble might burst.