Skip to content

The S&P 500 erases $1.2 trillion from its market cap in hours

The S&P 500 erases $1.2 trillion from its market cap in hours
Elmaz Sabovic

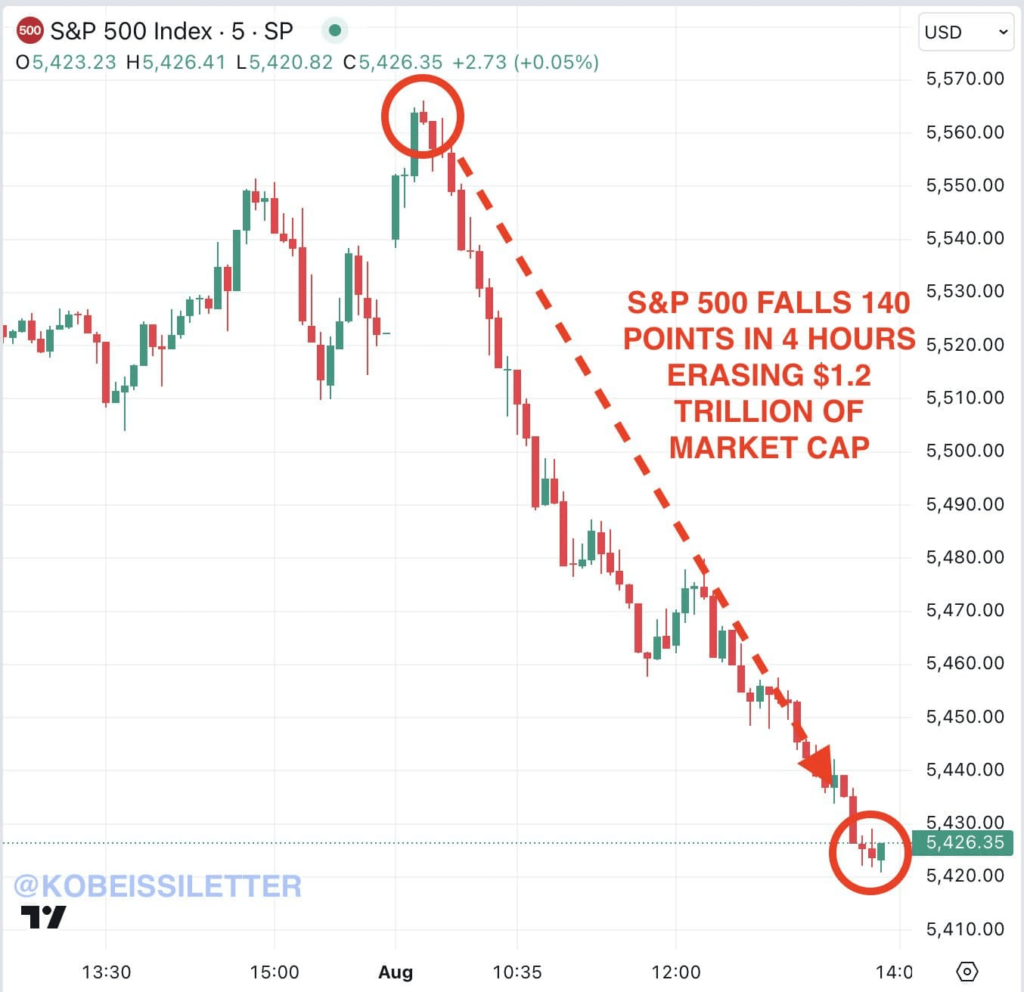
In 2024, stock market indexes posted a strong performance, with the S&P 500 setting new all-time highs on more than 30 occasions; however, the most recent trading session has seen the index erase $1.2 trillion in hours.

S&P 500 lost $1.2 trillion of market cap on August 1. Source: The Kobeissi Letter

What exactly happened with the S&P 500 on August 1?

On August 1, the S&P 500 plunged 140 points in just four hours, wiping out $1.2 trillion in market capitalization since its early morning peak, falling from $46.9 trillion to $45.7 trillion as of the latest close.

To put this into perspective, the market cap lost by the S&P 500 is equivalent to the combined value of Walmart (NYSE: WMT) and JPMorgan (NYSE: JPM).

S&P 500 performance during the August 1 trading session. Source: Google Finance

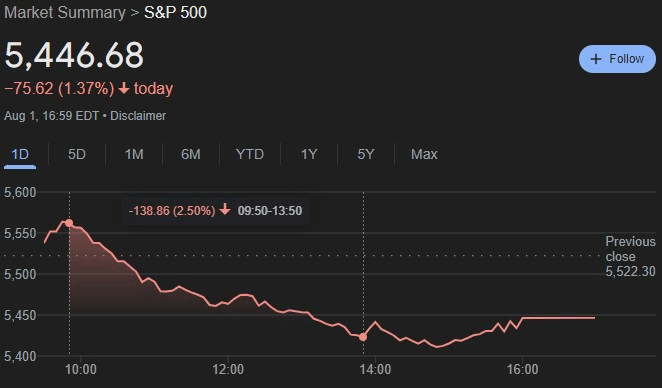
Since then, the index recovered and lowered its losses to 1.37%, allowing it to close the August 1 trading session at 5,446.68 valuation. 

Despite the fact that multiple companies that belong to the S&P 500 posted a beat on earnings during the current earnings season, the broader market sentiment signals fear and extension of losses into the August 2 trading session.

The Standard and Poor’s 500 tracks the performance of the U.S. 500 largest companies by market cap, representing their combined performance over the singular trading session and longer historical periods, and is regarded as an important metric of the overall market health.

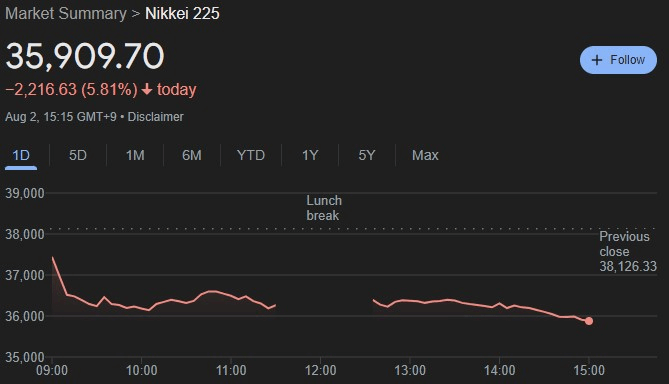
Japan’s stock market recorded its largest one-day drop in almost 40 years

Meanwhile, across the Pacific, Japan’s Nikkei index suffered its largest one-day decline of the year on August 2, marking the second-largest drop in its history. 

This significant fall was the biggest in over 36 years since the index plunged 3,836 points on October 20, 1987, the day following the Black Monday crash.

The Average closed at 35,909.70, marking a decline of 2,216.63 points or 5.81% from the previous trading session on August 1.

Nikkei index performance on August 2. Source: Google Finance

With the Dow Jones Industrial Average already down in the latest trading session, markets outside the U.S. are seemingly pricing in the recession.

Best Crypto Exchange for Intermediate Traders and Investors

  • Invest in 70+ cryptocurrencies and 3,000+ other assets including stocks and precious metals.

  • 0% commission on stocks - buy in bulk or just a fraction from as little as $10. Other fees apply. For more information, visit etoro.com/trading/fees.

  • Copy top-performing traders in real time, automatically.

  • eToro USA is registered with FINRA for securities trading.

30+ million Users
Securities trading offered by eToro USA Securities, Inc. (“the BD”), member of FINRA and SIPC. Cryptocurrency offered by eToro USA LLC (“the MSB”) (NMLS: 1769299) and is not FDIC or SIPC insured. Investing involves risk, and content is provided for educational purposes only, does not imply a recommendation, and is not a guarantee of future performance. Finbold.com is not an affiliate and may be compensated if you access certain products or services offered by the MSB and/or the BD

Read Next:

Finance Digest

By subscribing you agree with Finbold T&C’s & Privacy Policy

Related posts

Disclaimer: The information on this website is for general informational and educational purposes only and does not constitute financial, legal, tax, or investment advice. This site does not make any financial promotions, and all content is strictly informational. By using this site, you agree to our full disclaimer and terms of use. For more information, please read our complete Global Disclaimer.