
BlackRock‘s iShares Russell 2000 ETF (NYSE: IWM) is one of the most popular exchange-traded funds (ETFs) for U.S. small caps. After a brief rally in the stock market, these small-cap stocks have seen a massive capital outflow, illustrated by IWM losing over $3.5 billion in a week.
Eric Balchunas, senior ETF analyst on Bloomberg, first reported this trend on August 9, with a $3.5 billion outflow. The analyst highlighted “the trading crowd” fleeing from the small caps, saying that “it was fun while it lasted.”
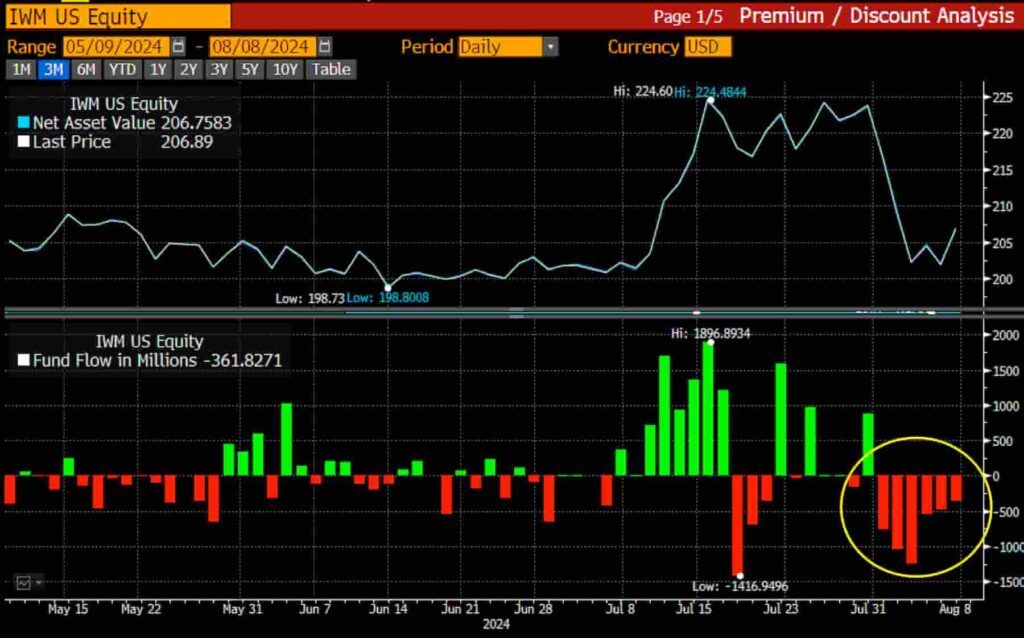
Notably, this net flow results from the last seven days of IWM trading. It started with a small $155 million outflow on July 31, followed by a $872 million inflow on August 1. Then, August 2 started a six-day sequence of capital leaving the fund – with a $758 million initial outflow.
As observed in the chart, these outflows were enough for the IWM price to return to $206.89, a level it was consolidating at before a large capital inflow that lasted two weeks and made the ETF peak at nearly $225.
BlackRock’s iShares Russell 2000 ETF (IWM): The small-cap stock index
Essentially, the iShares Russell 2000 ETF gives investors exposure to the Russell 2000 index, which follows small-cap stocks’ performance. The fund registers 9.91% gains year-over-year but a 2.68% loss in the last three years.
Nevertheless, IWM investors are still winning in the long term, with nearly 7% accumulated gains in the last five and ten years.
On August 9, the ETF registered a daily volume of $20.95 million and net assets of $63.87 billion. Interestingly, BlackRock’s small-cap fund currently holds 1,979 stocks from the small companies indexed by the Russell 2000. Finbold retrieved this data from iShares at the time of writing.
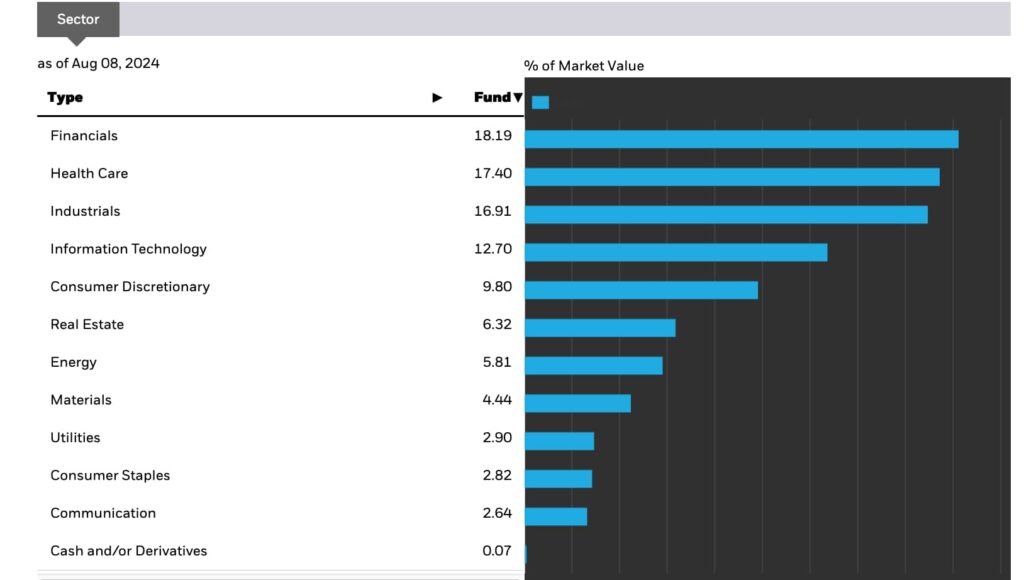
Most of these holdings are from financials, health care, and industrials – representing 52.5% of all the sectors. Financials lead with 18.19%, while health care and industrials have 17.4% and 16.91%, respectively.
It is noteworthy that the recent massive $3.5 billion outflow happened amid increased recession fears in the United States.
Macroeconomic data, the dollar’s carry trade against the yen, labor market statistics, and geopolitical tensions are among the causes of an increased uncertainty that could encourage the “trading crowd” to risk-off from highly volatile assets like small-cap stocks and allocate to more conservative investment vehicles.
Interestingly, as the Russell 2000 loses performance against solid assets like gold, an analyst related this to a potential Bitcoin (BTC) parabolic rally, as reported by Finbold.
Disclaimer: The content on this site should not be considered investment advice. Investing is speculative. When investing, your capital is at risk.